Sales Pipeline Reports That Drive Real Decisions
Learn how to design sales pipeline reports that expose forecast risk, tie activity to revenue, and turn weekly reviews into action rather than status updates.
Monday morning, the pipeline dashboard is green. Coverage looks acceptable, stage counts appear balanced, and every account executive has a reason their largest opportunities should close. By Friday, two close dates have moved, one “committed” deal has gone quiet, and the forecast call has become a debate about whose CRM notes to trust.
That pattern is common in B2B revenue teams, especially when sales pipeline reports summarize deal value and stage but ignore the inputs that created each opportunity. A report can show enough pipeline to hit target while hiding weak buyer access, stale movement, poor qualification, and untracked outbound sources. The fix isn't another decorative chart. It's a reporting system that connects revenue outcomes to signals, lists, messages, channels, and buyer engagement.
Table of Contents
When a Green Pipeline Still Misses
The Monday review starts with a coverage ratio of 3.8x. The team has enough total opportunity value on paper, and the funnel contains a reasonable spread across qualification, discovery, proposal, and negotiation. The reps describe their deals with confidence. One says the prospect is “very interested.” Another says procurement is “almost done.” A third points to a close date near the end of the quarter and explains that the buyer needs only a final internal approval.
Nobody asks whether the economic buyer has been verified, whether the technical evaluator has joined, or whether the customer has accepted a mutual next step. The dashboard records stage, amount, owner, and close date. It doesn't record whether the opportunity has a real buying committee behind it.
The first few weeks pass without obvious damage. A discovery deal moves into proposal because a document was sent. A negotiation opportunity remains in the same stage, but the rep updates the close date rather than documenting progress. Another deal receives activity from a single friendly contact, while the people who control budget, security, and implementation remain invisible.
The three failures behind the green status
By the middle of the quarter, the slippage starts to cascade. The proposal deal needs technical review, the negotiation deal stops responding, and the “committed” opportunity turns out to have no mapped buyer with authority to approve the purchase. The team still carries the same opportunities, but the dates have drifted and the evidence behind the forecast has weakened.
The quarter closes 40% below plan in this operating scenario. The problem isn't that the team lacked a coverage formula. It's that the aggregate number concealed three separate risks:
Unverified buyers: An opportunity can have a large amount and late stage without a documented economic buyer, technical champion, or agreed decision process.
Date-driven progression: A pushed close date can make a forecast look current even when the deal hasn't advanced through a meaningful buyer event.
Untracked sources: Pipeline created by a specific intent signal, list, message, or channel gets blended into the total, so leaders can't tell which inputs produce qualified revenue.
Practical rule: A close date is an estimate, not evidence of progress.
Industry guidance on healthy pipeline reporting identifies coverage, stage conversion, deal velocity, deal aging, and buyer readiness as separate diagnostic dimensions, while also warning against undefined stage criteria, stagnant opportunities, inflated values, and manual data dependence. Those dimensions provide the framework for finding the failure earlier, while attribution shows whether the pipeline was built from repeatable inputs or accumulated through optimistic CRM maintenance. Healthy pipeline guidance supports that broader diagnostic approach.
The Five Metrics That Actually Predict Revenue
A useful report answers five questions. How much pipeline exists? Where does conversion break? How long do deals take? Which opportunities are aging? Is a real buying process underway? Coverage alone can't answer all five.
Start with the standard coverage calculation, total pipeline value divided by the revenue target for the period. Some teams use a win-rate-adjusted benchmark instead of a fixed rule, while independent guidance commonly places a 3x to 4x floor or target for many B2B teams. Other organizations use a 3:1 to 5:1 range. Those benchmarks should be adapted to actual close rates, because higher-win-rate segments need less coverage and lower-win-rate segments need more. Pipeline coverage guidance and HubSpot's coverage definition outline the calculation and the limits of blanket ratios.
Build the diagnostic layer
Use separate fields for raw pipeline, weighted pipeline, remaining target, stage, stage-entry date, last activity, next step, buyer role, source, signal, list, message, channel, ICP segment, and geography. Then calculate the following:
Metric | Calculation | Required Fields | Warning Threshold |
|---|---|---|---|
Coverage | Total pipeline value ÷ revenue target. Also calculate weighted pipeline ÷ remaining target. | Amount, target, stage probability, close period | Coverage below the team's win-rate-adjusted need, or unusually high coverage that may indicate inflated values |
Conversion | Opportunities entering the next stage ÷ opportunities entering the current stage during a selected trailing window | Stage history, entry dates, segment, source | A stage-to-stage rate materially below the historical baseline for that segment |
Velocity | Average days in each stage, plus total days open | Stage-entry dates, current stage, close date, historical cycle data | Stage duration above the normal baseline or repeated delay without a buyer event |
Aging | Open opportunities past the expected age for their current stage ÷ total open opportunities in that stage | Stage age, expected stage duration, opportunity status | A growing share of opportunities beyond expected stage age |
Buyer readiness | Count of verified economic and technical champions with documented next steps | Contact roles, stakeholder status, next meeting, mutual action plan | No verified buying authority, no technical owner, or no agreed next action |
Conversion needs segmentation. A blended funnel can hide a weak outbound motion behind stronger inbound performance. Calculate movement by ICP, rep, geography, source, and signal cohort so managers can distinguish qualification problems from execution problems.
Velocity needs history. A deal that has been open for a long time isn't automatically lost, but a deal that exceeds its expected stage age without new buyer activity deserves intervention. Track both days per stage and total days open. The first reveals bottlenecks, while the second exposes opportunities that have survived too many forecast cycles.
Buyer readiness is evidence, not sentiment. “Good relationship” isn't a field that should move an opportunity forward. A documented economic buyer, technical champion, decision criteria, and next meeting provide a more defensible view of readiness. For a related view of lifecycle stages and KPI design, see customer lifecycle stages and KPIs.
Stage counts and opportunity totals feel reassuring because they're easy to aggregate. They don't predict revenue until the report shows how deals move, how long they remain stuck, and whether the buyer has taken a verifiable step.
Designing Stage Criteria and Snapshot Logic
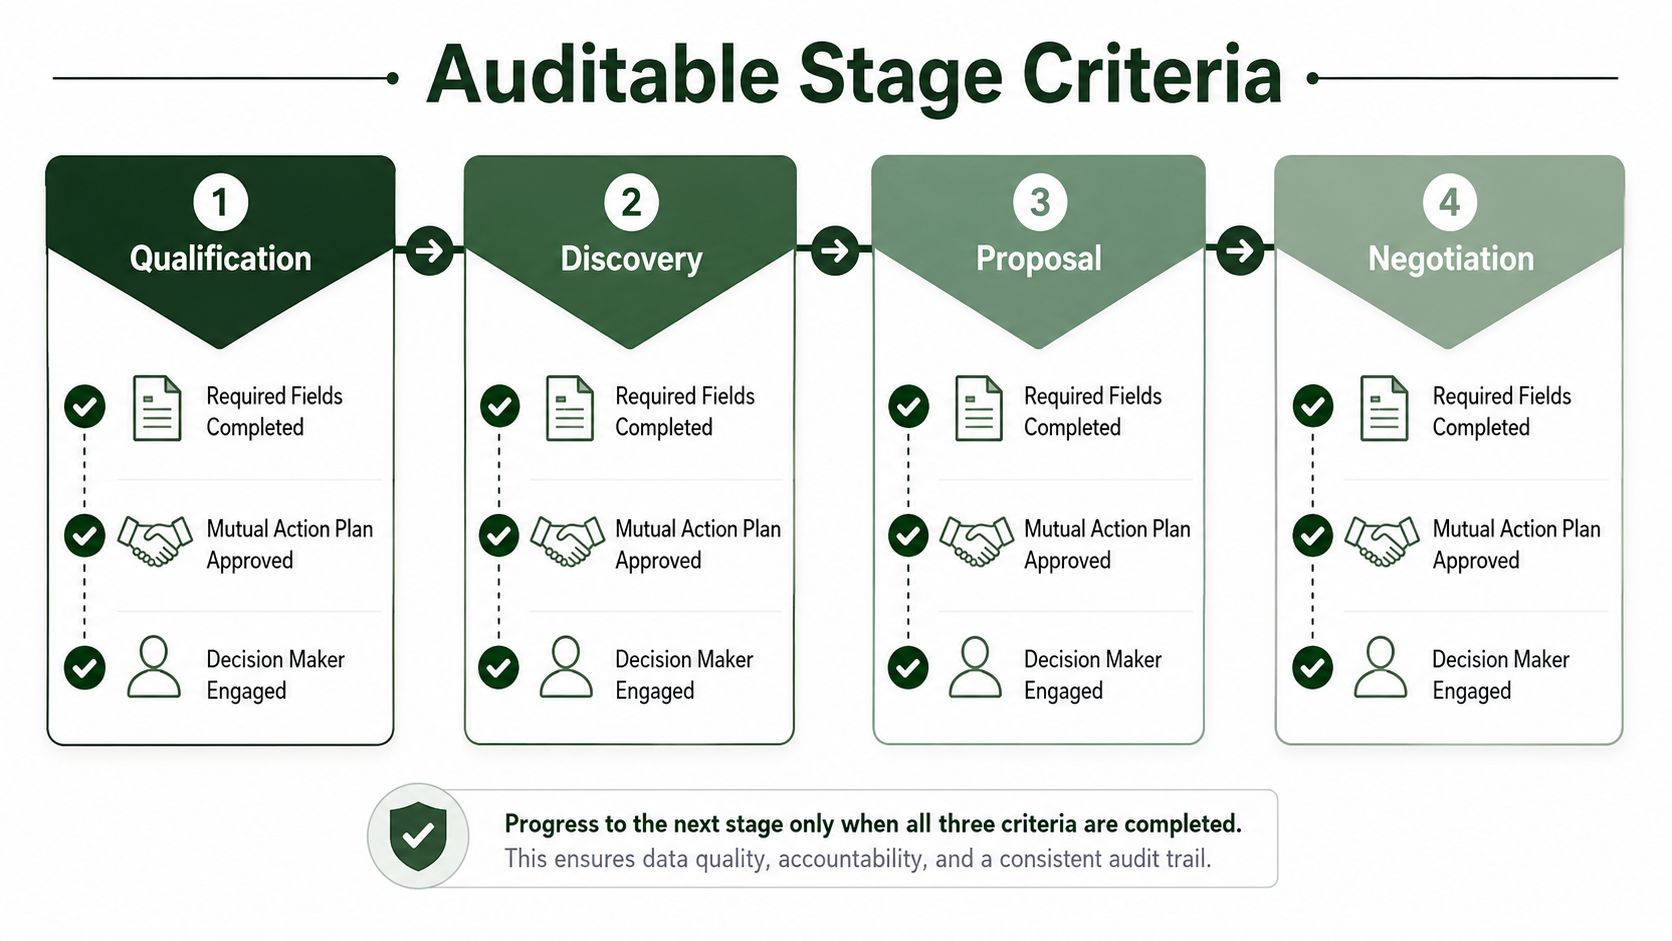
Reps shouldn't have to narrate their way through a CRM stage. If “proposal” means a document was emailed to one rep and a commercial review was completed with another, the conversion report is measuring inconsistent processes.
Define every stage with three types of checks:
Required fields completed: Capture budget status, decision criteria, buying timeline, next meeting, and relevant stakeholder roles.
Qualifying events logged: Record events such as an attended demo, a completed discovery, a proposal review, or a security process that has started.
Explicit disqualifiers: Prevent progression when the opportunity lacks buyer access, has no agreed problem, has no next step, or depends only on a rep's subjective confidence.
Turn criteria into controls
Map each exit criterion to a CRM field, event, or related record. Use validation rules to block stage movement when mandatory evidence is missing. Picklist dependencies can keep fields relevant to the selected segment or opportunity type, while automation can create a task when a deal enters a stage without a scheduled buyer action.
Keep the criteria strict enough to protect forecast integrity, but not so elaborate that reps work around them. A small set of observable requirements is more useful than a long checklist nobody completes. The reporting and pipeline dashboard service provides a useful reference point for consolidating those controls into an operational view.
Current-state CRM reports still can't show whether a close date moved repeatedly or whether an opportunity spent most of its life in one stage. That requires history. Create a nightly snapshot of open opportunities containing stage, amount, close date, stage age, owner, forecast category, last activity, and buyer-readiness fields. Nightly snapshots are specifically recommended because aging and slippage require historical states, not only the latest CRM record. Pipeline snapshot guidance explains that approach.
A point-in-time snapshot answers, “What did the pipeline look like on that date?” A delta log answers, “What changed between records?” Most Salesforce and HubSpot setups benefit from a hybrid. Store a nightly record for every open opportunity, then derive deltas for stage changes, amount edits, owner changes, and close-date movement.
That makes silent optimism visible. A deal whose close date moves across several snapshots without a stage event appears as slippage. An amount that repeatedly expands and contracts becomes a qualification issue rather than a healthy pipeline trend.
Slicing Reports by Signal, List, and Channel
The top-line pipeline number is only the output. Managers need to inspect the inputs that produced it.
Add attribution fields when an opportunity is created, not after the deal reaches proposal. At minimum, capture originating signal, source list, message variant, channel, ICP segment, geography, campaign, and first-touch date. For outbound teams, separate the original opportunity source from later engagement sources. Otherwise, a reactivated old record can receive credit for a campaign that didn't create the buying motion.
A practical CRM field map might look like this:
Signal: Intent surge, hiring signal, technographic trigger, partner event, or no recorded signal.
List: Tier-1 ICP, nurture pool, event scrape, account-based list, or referral list.
Message: Sequence version, offer angle, pain hypothesis, and call-to-action variant.
Channel: Email, LinkedIn, referral, event, inbound, or partner.
Context: ICP segment, industry, account tier, region, and country.
Outcome: Meeting held, qualified opportunity, closed-won, closed-lost, loss reason, and opportunity create date.
Read the cuts, not just the totals
A worked example illustrates why this matters. A technographic signal can generate a 40% reply rate while the resulting pipeline converts at 8% if the message promise overstates what the product can deliver. Those figures are scenario examples, not universal benchmarks, but the reporting lesson is durable: reply volume can look excellent while commercial quality is weak.
A low-volume hiring-signal list can also drive 22% of closed-won revenue when the ICP fit is tight. That cut may justify expanding the signal definition, even if the list produces fewer meetings than a broad prospecting segment. Preserve the source, signal, and message values through opportunity creation and closed-won reporting so the team can connect activity to revenue.
Slice | Metric to Surface | Decision It Drives |
|---|---|---|
Signal | Qualified pipeline and closed-won rate by trigger | Keep, refine, or remove the trigger |
Source list | Conversion, deal age, and revenue by list cohort | Prune weak lists or invest in high-fit accounts |
Message | Positive replies, meetings, qualification, and loss reasons | Rewrite the promise or reposition the offer |
Channel | Pipeline value, velocity, and buyer readiness | Rebalance channel effort |
ICP segment | Stage conversion and closed-won quality | Narrow or expand the target profile |
Geography | Engagement, cycle movement, and stakeholder depth | Localize timing, language, and routing |
Teams that need to connect conversation data with CRM actions may also find automatización CRM conversacional useful when designing workflows around qualification, routing, and follow-up. For segmentation architecture, B2B marketing segmentation offers a relevant companion framework.
The manager's decision should change with each cut. A weak message needs rewriting. A weak list needs pruning. A weak geography may need local data or timing. A weak signal may be generating activity without genuine buying intent.
Dashboard Layouts and Refresh Cadence
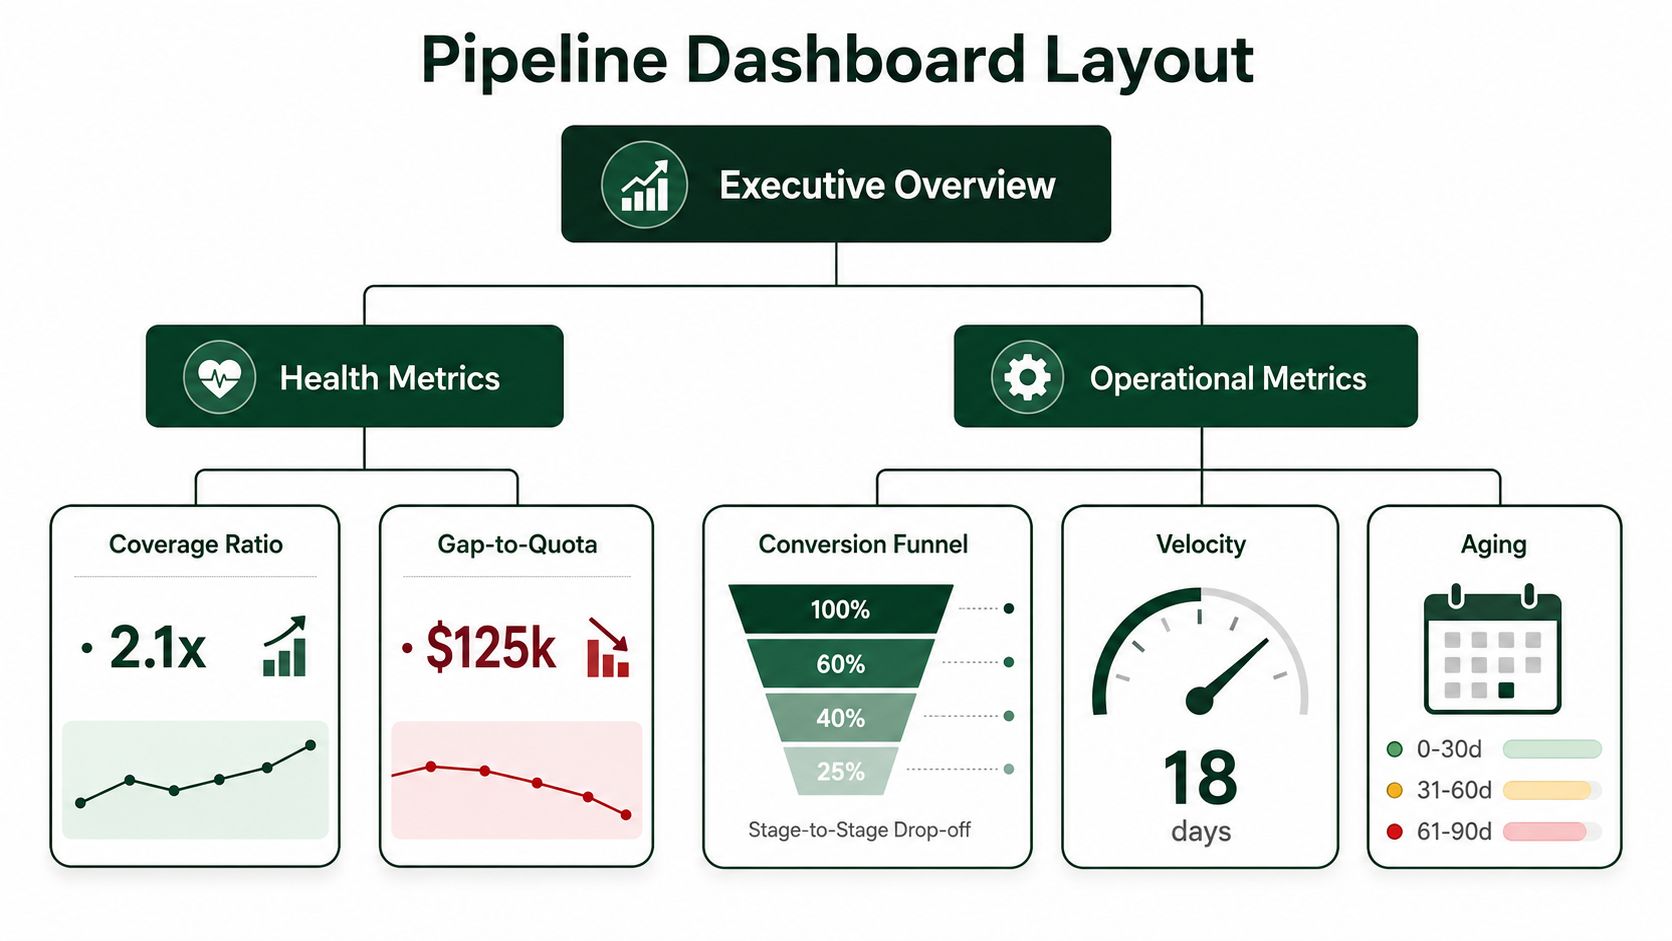
A dashboard should help a manager decide what to do next without opening six reports. Put the executive summary on the first tab and operational detail on the second. The first tab supports weekly leadership review. The second supports account-level coaching and rep one-to-ones.
Use the chart that matches the question:
Coverage and gap to quota: Use a single KPI block with a delta bar. Show total coverage beside the remaining target gap so a healthy ratio doesn't obscure an absolute shortfall.
Stage conversion: Use a funnel with stage-to-stage drop-off annotated. A funnel without movement rates is only a count of inventory.
Velocity and aging: Use a heatmap by stage and weeks stuck. Color should reflect deviation from expected movement, not just deal value.
Forecast risk: Use a scatter plot with deal size on one axis and commit confidence on the other. Large deals with high confidence but weak buyer evidence deserve immediate attention.
Attribution: Use cohort tables or stacked bars by signal, list, message, channel, ICP, and geography. Avoid placing every dimension on one crowded visual.
A modern operational dashboard is generally refreshed daily, while hourly syncing can create noise. One dashboard guide recommends daily visibility for pipeline changes and weekly review rhythms for revenue and forecast metrics. Dashboard refresh guidance supports that cadence. For active-stage decisions, some teams may sync opportunity changes more frequently, but that shouldn't replace the nightly historical snapshot required for aging and slippage analysis.
Design for behavior change
The visuals that consistently prompt action are the aging heatmap, the commit-confidence scatter, and the stage conversion view. They expose a specific deal, stage, or owner that needs attention.
Leaderboards, decorative gauges, and total activity counters often get ignored. They can make a dashboard look complete without helping an AE decide which buyer to contact, which deal to requalify, or which close date to remove.
A revenue operations team can also use a knowledge layer such as Donely's company brain solution when it needs deal context, internal documentation, and operating knowledge available alongside dashboard workflows. The broader revenue operations guide provides context for assigning ownership across data, process, and reporting.
Running Pipeline Reviews That Drive Action
The weekly pipeline review is one of the most misused meetings on the GTM calendar. When every rep reads out deal status, the meeting becomes a broadcast. Managers hear the same optimism that already exists in the CRM, while stale opportunities remain untouched.
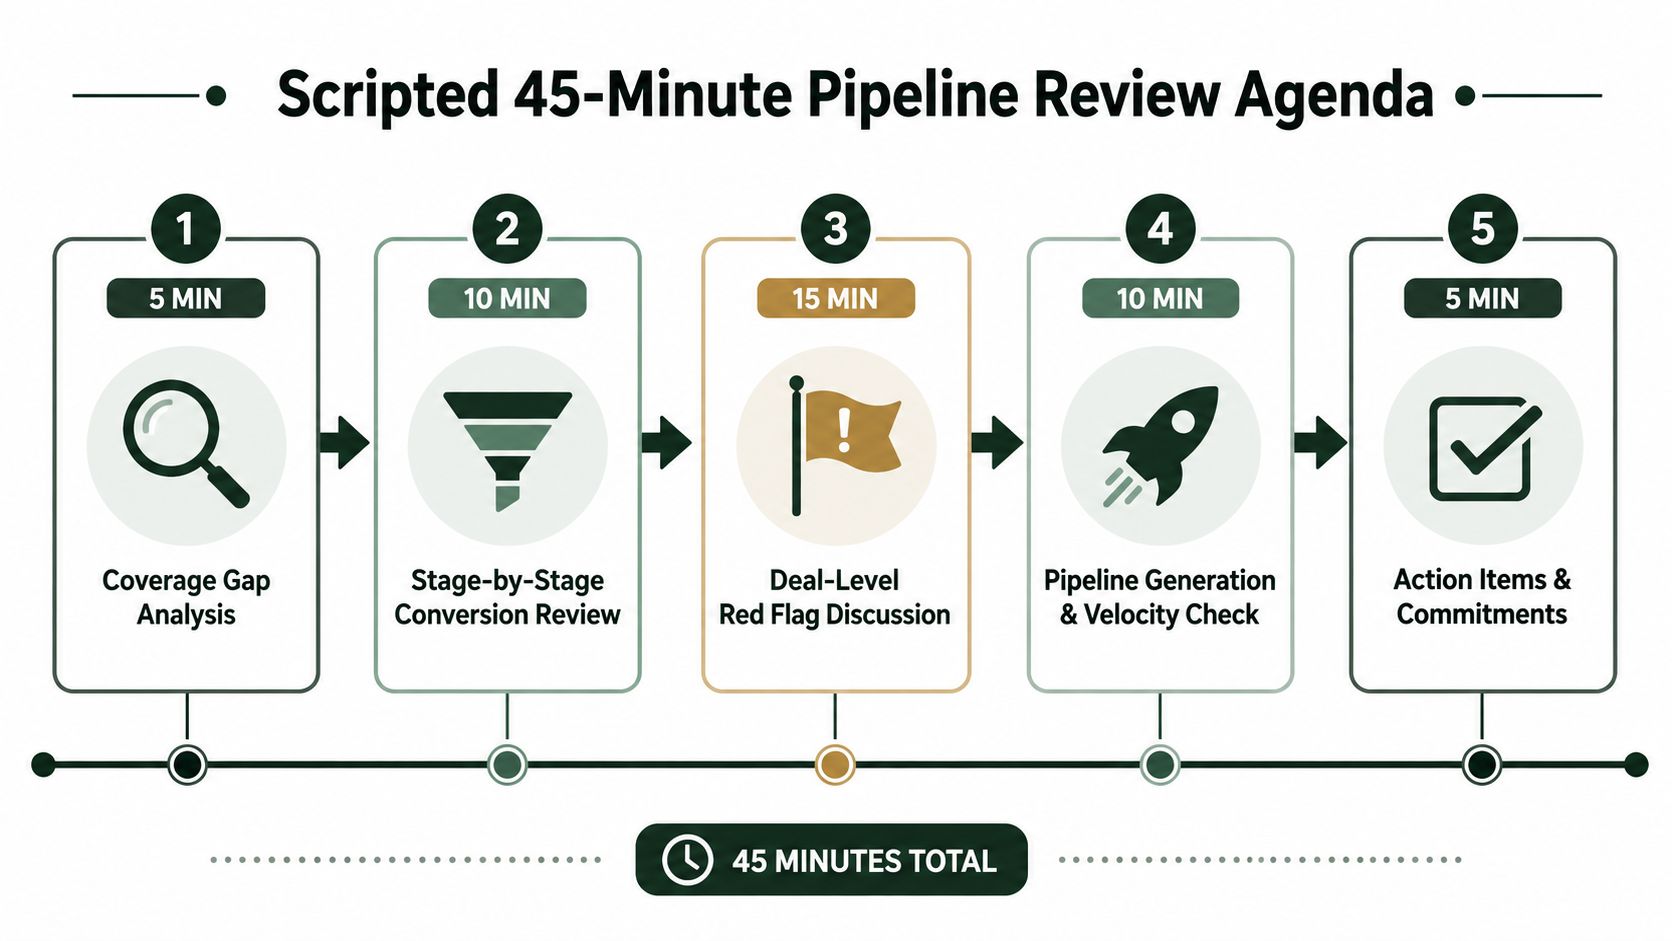
Run the meeting as a 45-minute action review:
5 minutes, coverage gap: Compare remaining target with raw and weighted pipeline. Identify whether the gap comes from insufficient creation, weak conversion, or pipeline that has aged beyond expectations.
10 minutes, aging heatmap: Review only deals that sit beyond expected stage age or have no recent buyer activity.
15 minutes, commit slips: Discuss opportunities whose close date moved or whose stage hasn't changed despite a forecast commitment. Each deal needs either a documented stage move, a defensible close-date change, or removal from the forecast.
10 minutes, source attribution: Look for shifts by signal, list, message, channel, ICP, and geography. A pipeline-generation problem may sit in one cohort rather than across the whole team.
5 minutes, owner actions: Write the action, owner, deadline, and evidence required for completion. “Follow up” isn't an action. “Secure a technical validation meeting with the implementation lead” is.
Remove stale inventory
Set a firm rule for stale deals. An opportunity older than 2x its stage average, with no next step and no executive engagement, gets closed-lost regardless of manager opinion. The rule protects forecast integrity because a stale deal consumes attention and inflates available pipeline without providing current buyer evidence.
Managers can reopen an opportunity when the buyer returns with a credible event, but they shouldn't preserve it indefinitely because the account “might come back.” Closed-lost data is more useful than an open pipeline full of unresolved hope. It gives the team a loss reason, a reactivation path, and a cleaner view of what must be created next.
A review can also benefit from a structured signals and data sources framework, particularly when teams need to assess whether new pipeline comes from reliable market inputs or untracked research.
A Phased Build Plan and Quarterly Audit
A reporting system becomes useful faster when the team ships it in layers. Start with definitions and a trustworthy history table, then add diagnosis and attribution. Don't wait for a perfect data model before giving leaders a view they can use.
Build in controlled phases
Week 1 should deliver stage definitions, coverage and conversion formulas, and one executive summary tab sourced from CRM snapshots. The first release should answer whether the team has enough pipeline and where movement breaks.
Week 2 adds aging, velocity, and hygiene alerts. Flag opportunities with missing next steps, old close dates, incomplete buyer roles, or excessive time in stage. These controls stop stale inventory from poisoning the forecast.
Week 3 adds signal, list, message, channel, ICP, and geography cuts. Use UTM values, campaign tags, source-of-opportunity fields, and immutable opportunity-create dates. Don't let a later re-engagement campaign overwrite the original source of a deal that eventually closes.
Weeks 4 to 6 ship the weekly review dashboard and the kill-stale-deals workflow. Give managers drill-down access from every KPI to the underlying opportunity, evidence, owner, and next action.
Phase | Deliverable | Owner | Exit Criteria |
|---|---|---|---|
Week 1 | Stage definitions, coverage, conversion, executive tab, CRM snapshots | RevOps and sales leadership | Leaders agree on stage meaning and can reconcile pipeline totals |
Week 2 | Aging, velocity, and data-hygiene alerts | RevOps and CRM administration | Managers can identify stale deals and missing evidence |
Week 3 | Signal, list, message, channel, ICP, and geography attribution | Marketing operations, SDR leadership, RevOps | Every new opportunity carries source context through closed-won or closed-lost |
Weeks 4 to 6 | Review dashboard and stale-deal workflow | Sales leadership and frontline managers | Weekly reviews produce named actions and removed inventory |
Quarterly audit | Criteria review, field pruning, cadence check, metric benchmarking | RevOps, CRM admin, sales managers | Reporting reflects the current sales process and prior-quarter learning |
Run the audit each quarter. Revalidate stage criteria with frontline reps, remove fields nobody uses, confirm the snapshot cadence still matches CRM changes, and compare the five diagnostic metrics with prior periods. A dashboard should evolve with the sales motion, not become a static artifact that nobody questions.
Teams building qualified outbound revenue can use this pipeline generation guide to connect reporting inputs with the prospecting system that creates them. The Social Search designs and operates outbound systems for B2B teams across APAC and global markets, including ICP and list building, signal-driven prospecting, messaging, channel operations, and pipeline dashboards that attribute results to specific sources.
The Social Search can help you build sales pipeline reports that connect CRM outcomes to the signals, lists, messages, and channels that produced them. Visit The Social Search to discuss a reporting build, an outbound system, or fractional GTM support for your APAC or global expansion.
