Data Pipeline Dashboard: Build a GTM Reporting System
Learn to build a data pipeline dashboard for outbound GTM. This guide covers metrics, tools like Instantly and Apollo, and implementation steps for B2B teams.
74% of stakeholders discover data issues before their monitoring layer does, so a data pipeline dashboard must act as an operational control, not a vanity collection of charts. The reliable design separates a job that ran successfully from data that is fresh, complete, correctly routed, and safe to use.
The familiar scene is a green dashboard beside an unhappy sales team. The CRM sync completed, campaign activity arrived, and the pipeline chart appears normal, yet representatives can't find leads, account ownership is wrong, and opportunity values don't match what they discussed with prospects. The dashboard isn't necessarily broken. It may be measuring the wrong layer.
For APAC-focused SaaS teams, this problem becomes sharper as sending tools, enrichment systems, LinkedIn activity, forms, analytics, and CRM workflows accumulate. A reporting layer can show meetings and revenue while hiding the ingestion gap, schema mismatch, duplicate account, or failed routing rule that caused the decline.
Table of Contents
Why Most GTM Dashboards Hide the Root Causes
A CRM sync can show green while sales works with missing leads, incorrect owners, or opportunity values mapped to the wrong field. Outcome charts may report sent emails, replies, and meetings accurately as system events, yet still fail to show whether the underlying records are complete and meaningful.
That distinction defines a reliable data pipeline dashboard. Technical success means a job ran and returned without an error. Data trustworthiness means the expected records arrived, retained their meaning, passed validation, and reached the correct workflow. The first is a process status. The second determines whether revenue reporting deserves confidence.
A survey benchmark found that stakeholders discover data issues first in 74% of cases, meaning business users often become the monitoring layer themselves (survey benchmark on stakeholder data-issue discovery). By the time a salesperson reports a missing lead, the defect has already entered a decision-making process.
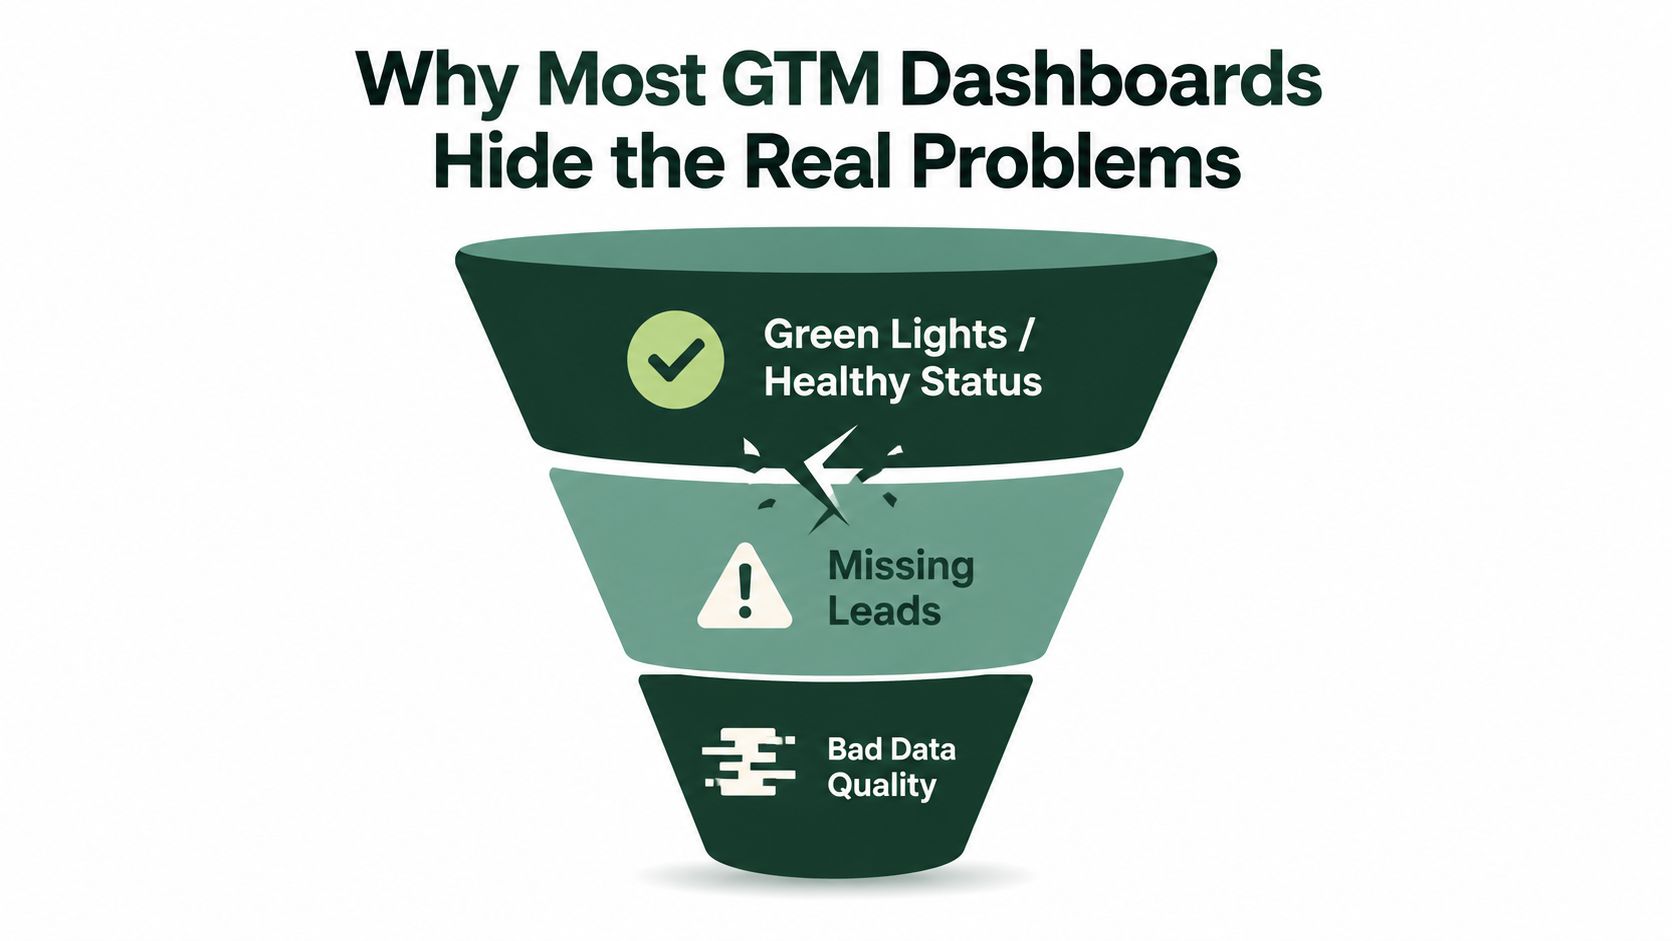
The green light problem
A useful dashboard follows each record from source event to business decision:
Ingestion: Did the sending platform, form, enrichment provider, or activity system deliver every expected record?
Transformation: Did normalization, deduplication, enrichment, and field mapping preserve the original meaning?
Routing: Did the correct account owner, campaign, segment, and lifecycle stage receive the record?
Consumption: Can sales and marketing use the result without manual repair?
Reporting shows that meetings fell. Observability helps determine whether demand weakened or a connector stopped importing replies. For a practical view of how activity reporting fits into sales operations, compare the structure of a sales pipeline report. Its value comes from linking output metrics to the processes that produced them.
Practical rule: Every business KPI should trace back to its source record, transformation rule, and owner responsible for its accuracy.
A 2023 academic study identified incorrect data types as 33% of data-related problems and cleaning-stage defects as 35% of pipeline issues (academic study of data-pipeline quality). In GTM operations, that can mean an opportunity value arriving as text, inconsistent country names blocking territory assignment, duplicate accounts splitting activity, or a lifecycle stage failing validation.
The dashboard should expose these upstream conditions before they distort revenue reporting. Final totals alone can give a team confidence without giving it control. Reliability comes from showing both whether the job ran and whether the resulting data is fit for use.
Choosing the Right Tools for Your Outbound Stack
A consolidated dashboard starts with a stack that produces usable events. Disconnected tools force the reporting layer to infer relationships after the fact, and that usually creates fragile joins, duplicated contacts, and unclear ownership.
For cold email, Instantly is a practical sending and sequencing layer to connect with campaign, mailbox, reply, and bounce events. The dashboard should ingest those events with stable campaign and prospect identifiers rather than relying on contact names or manually typed labels. That makes it possible to distinguish a reply from a campaign, sequence step, segment, and sending period.
LinkedIn activity needs the same discipline. HeyReach can provide the automation layer for connection and conversation activity, while the reporting model should retain the prospect, sender, campaign, and status relationships. Don't collapse LinkedIn activity into a single “social touches” total. A connection accepted and a qualified conversation represent different operational states.
Build around clean source ownership
Enrichment is where many GTM pipelines become unreliable. Apollo can support contact and account enrichment, but the dashboard still needs to show which fields were returned, which were missing, when enrichment occurred, and whether a later update overwrote a trusted value. Completeness is more useful than a vague “enriched” flag.
Intent data belongs in the routing model, not in a decorative widget. Whitewhale can supply signal-based intent inputs that help teams prioritize accounts, provided each signal has a timestamp, account key, source, and action rule. A signal that can't be traced to a routing decision is just another unverified field.
Outbound shouldn't operate in isolation from demand capture. For technical SEO monitoring, SearchAtlas can sit alongside outbound sources, allowing the team to relate organic discovery and outbound activity without pretending they are the same channel. The dashboard should preserve channel-specific definitions rather than forcing every interaction into one blended score.
Don't automate bad inputs
The tools are only the collection layer. Before connecting them, define canonical identifiers, required fields, ownership rules, and acceptable delays. A completed sync from an inconsistent source doesn't improve reporting. It just moves the inconsistency into a more attractive interface.
For teams designing sending infrastructure around these connections, cold email infrastructure guidance is useful because deliverability events and CRM outcomes need a common operational model. The dashboard becomes dependable when every tool has a clear responsibility and every handoff has a validation check.
Mapping Essential Metrics and Routing Logic
Start with the event model, not the chart library. A GTM dashboard should show the sequence from signal capture to qualified pipeline, while retaining enough detail to explain where a record stalled.
Cold email needs more than a sent count. Track delivery-related outcomes, opens, replies, and bounces with campaign, sequence, mailbox, prospect, and timestamp dimensions. A high reply total can conceal poor targeting if replies aren't linked to the relevant account and ICP segment.
LinkedIn requires a separate measurement vocabulary. Connection activity, accepted connections, conversations, and qualified responses should remain distinct. Combining them produces a flattering activity number but makes it difficult to identify whether the issue sits in targeting, the connection message, or the follow-up conversation.
SEO and inbound signals need another grain. Track organic visits to gated assets, form submissions, account identification where available, and the resulting routing state. Don't attribute a meeting to organic traffic merely because both records share a company name. Use a documented attribution rule and show the confidence or limitation of that rule.
Write the metric contract first
Before building visualizations, define a contract for every KPI:
Contract field | What to define |
|---|---|
Formula | The exact numerator, denominator, filters, and exclusions |
Grain | Whether the metric is measured per event, prospect, account, campaign, or opportunity |
Source tables | The systems and fields that provide the inputs |
Timestamp | Event time, ingestion time, processing time, or availability time |
Owner | The person or team responsible for the definition and data |
Target and latency | The expected operating level and acceptable delay |
This prevents common disputes such as whether a reply is counted when received, when imported, or when classified by a representative. It also makes channel comparisons more honest. An email reply and a LinkedIn conversation shouldn't share a label just because both are forms of engagement.
Make routing visible
Routing logic should be inspectable as a chain:
Capture the source signal, such as a reply, connection, intent event, form submission, or enrichment update.
Apply the ICP filter, including account fit, geography, role, and exclusions.
Normalize and enrich the record, preserving source values and update timestamps.
Assign the owner and stage, with a reason for the assignment.
Create or update the opportunity, retaining the originating campaign and signal.
The dashboard should let an operator drill from a pipeline total to the records that passed or failed each step. A Snowflake data platform case study offers useful context for thinking about time-series data structures and analytical serving layers, even when the GTM implementation uses a different warehouse.
For automation patterns that connect these stages, see sales pipeline automation. The point isn't to automate every decision. It's to make each automated decision observable enough to audit.
Designing the Dashboard for Reliability and Trust
A sending job can finish successfully while the CRM contains stale owners, malformed stages, or missing campaign attribution. The dashboard must expose that gap before sales uses the data.
Show pipeline health beside business outcomes. Track freshness, completeness, schema compliance, null rates, duplicate counts, failed transformations, and sync exceptions alongside meetings, opportunities, and revenue. Keep the job status visible, but give equal weight to whether the resulting records are usable.
The type-defect problem established earlier makes schema validation a first-class GTM control. Validate account values, stages, dates, owner fields, and enumerations before they reach downstream reports. Technical success confirms execution. Trust status confirms that the data can support a decision.
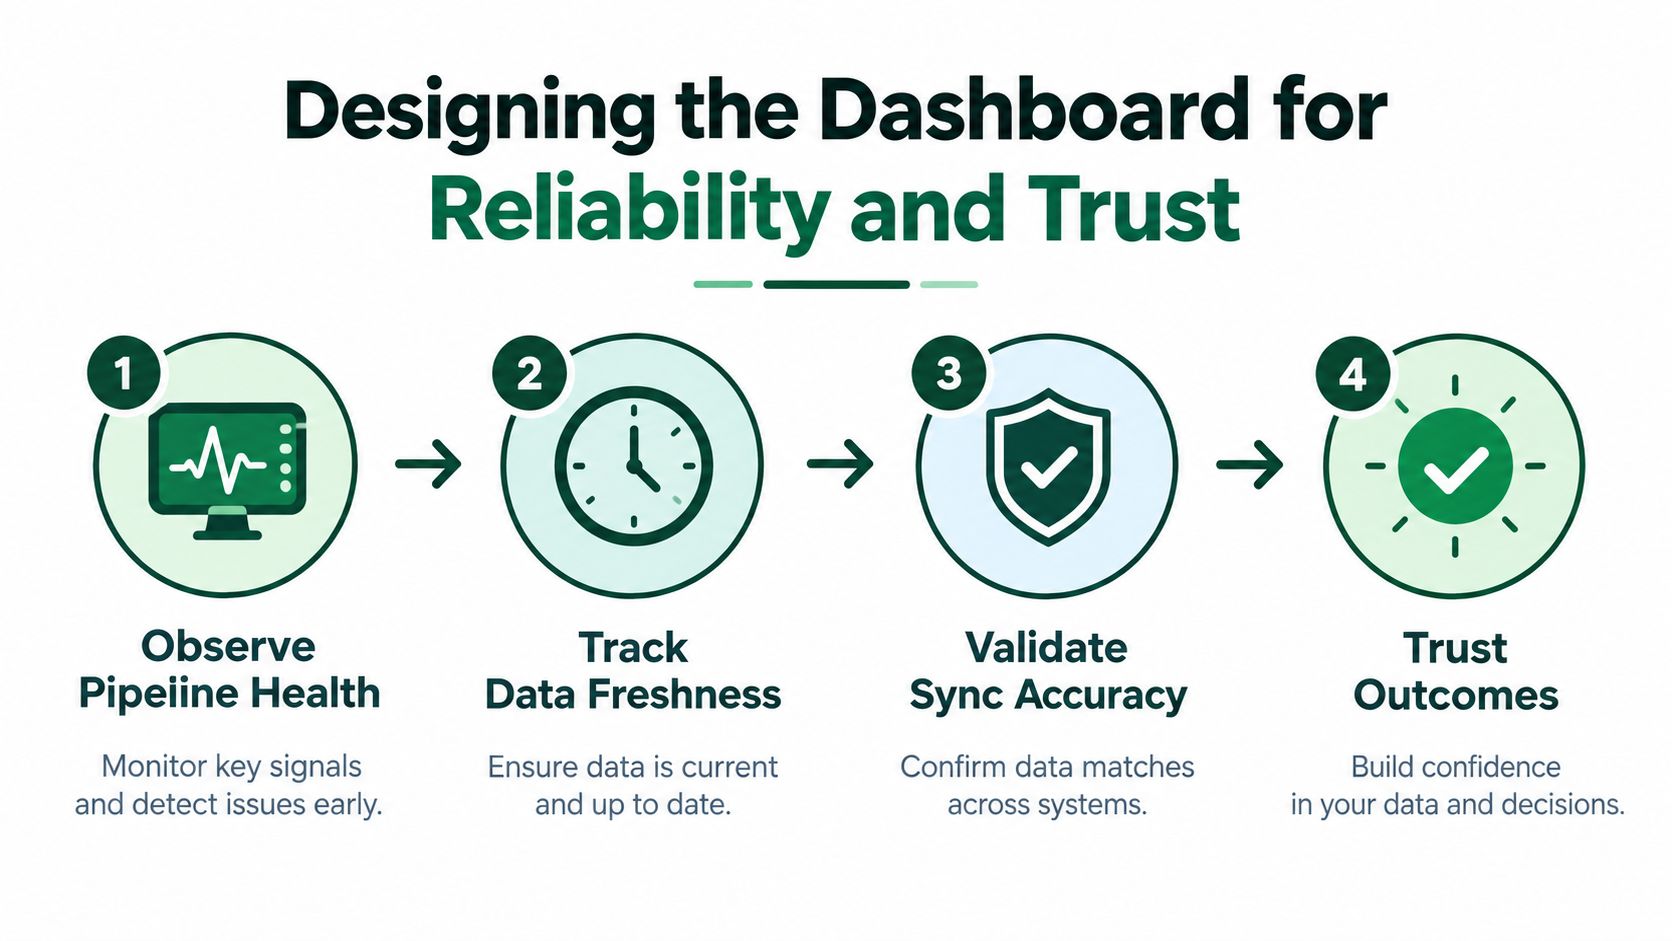
Validate the data, not just the run
Use checks that follow records from the sending tool into the CRM:
Compare row counts: Reconcile source and destination records while accounting for intentional filtering and deduplication.
Test field quality: Check null rates, duplicate keys, orphaned relationships, invalid enumerations, and unexpected type changes.
Verify attribution: Sample records against the originating campaign, signal, sender, account, and opportunity.
Test time logic: Confirm the intended timezone and distinguish event time from import and classification time, so late events remain visible.
Run backfills: Reprocess historical or delayed records and confirm that totals, stages, and ownership remain stable.
Apply safeguards for connectors to permissions, change control, and failure handling. These controls belong inside the pipeline design, because a connector can preserve a successful run while quietly writing the wrong fields.
Show evidence behind the headline
A single health number gives an operator too little context. Display the current value, trend, variance against target, last successful load, affected records, and a drill-through path to the originating system. For freshness, show both when the event occurred and when it became available to the dashboard.
Separate execution status from trust status:
Technical status | Trust status | Interpretation |
|---|---|---|
Green | Green | The job ran and quality checks passed |
Green | Warning | The job ran, but freshness, completeness, or validation needs attention |
Green | Breach | The job ran, but business-critical data is incomplete or incorrect |
Red | Unknown | The pipeline failed and downstream data cannot be assumed current |
Use the dashboard design best-practices guide to keep visual hierarchy tied to operational decisions. Aim for a view that lets an operator identify the smallest data failure capable of changing today's sales action, even if that means fewer charts.
Setting Up Alerts, SLOs, and Failures
Alerts need measurable objectives and business-aware severity. “Keep the data fresh” isn't an SLO. Google's SRE guidance gives a concrete accuracy example, no more than 0.1% of invoices being incorrect per quarter, which illustrates how an objective should define both the tolerance and the evaluation window (Google's data-processing SRE guidance).
Use the same discipline for GTM data. Define freshness as the maximum acceptable age, completeness as the expected proportion of source records present, latency as the time between event and availability, and accuracy as reconciliation against the system of record. Keep those dimensions separate instead of hiding them inside one health score.
Set urgency by business impact
A missing opportunity stage can block forecasting and ownership, so it deserves a higher severity than a modest volume deviation that doesn't affect routing. A stale enrichment field may be acceptable for a low-priority segment but unacceptable when it controls territory assignment.
The dashboard should show:
Current state: The value, threshold, and evaluation window.
Incident impact: Affected campaigns, accounts, owners, reports, or opportunities.
Responsibility: The dataset owner and escalation destination.
Resolution tracking: Time detected, time acknowledged, and time resolved.
Decision risk: Whether sales, forecasting, attribution, or customer commitments are affected.
Before handover, run a compact acceptance checklist:
Compare source and dashboard totals.
Test null, duplicate, orphan, and invalid-stage rates.
Verify attribution and timezone behavior.
Sample records against the CRM and sending tools.
Simulate a delayed load and confirm the alert fires.
Backfill records and confirm that historical totals reconcile.
Confirm that an operator can identify the owner and next action from the dashboard.
Email operations deserve their own failure view. A guide to email delivery failure can help connect sending problems to the reporting model, but the dashboard still needs to show whether a delivery issue affects one mailbox, a campaign, a segment, or the entire outbound process.
Don't alert on every anomaly. Excessive warnings train operators to ignore the interface. Hard failures should block trust, warnings should invite investigation, and informational deviations should remain visible without interrupting the team.
Finalizing the System for Handover and Scale
A dashboard becomes operational only when another person can run it without the builder standing beside them. That requires more than documenting chart names. The handover should include source ownership, field definitions, transformation logic, alert thresholds, escalation paths, known limitations, and the procedure for replaying or correcting a failed load.
The final validation pass should focus on the records that dashboards commonly mishandle. Check for orphaned contacts without accounts, opportunities without owners, activity without campaigns, and stage changes that arrive after the reporting window. Verify timezone logic across sending tools, CRM timestamps, and meeting records, especially when teams work across APAC markets.
Make ownership transferable
A system-first implementation leaves the client with control of the infrastructure and playbooks. Credentials, schemas, metric contracts, routing rules, test queries, incident procedures, and dashboard permissions should have named owners inside the operating team.
That structure protects the GTM function when a marketer, SDR, or operations specialist leaves. The replacement doesn't need to reconstruct why a field exists or which campaign created an opportunity. They can follow the documented path from source event to reported outcome.
Scale also exposes weak assumptions. A routing rule that works for one market may mishandle regional ownership, local time, language, or account hierarchy as the team expands across APAC. The solution isn't to create a separate reporting philosophy for every country. Keep the core event model consistent, then make territory, language, channel, and compliance rules explicit dimensions.
Measure what the business can act on
The finished view should answer operational questions quickly:
Which signal created the meeting?
Which list and message produced the opportunity?
Which records failed enrichment or routing?
Which pipeline totals are trustworthy right now?
Which incident should the team fix first?
That level of transparency is more useful than an impressive activity wall. It gives revenue leaders a defensible link between sending activity, buyer signals, sales actions, and pipeline while preserving the evidence needed to investigate exceptions.
The Social Search designs and runs outbound systems across ICP definition, data, messaging, sending, routing, and reporting for B2B teams selling into APAC and global markets. Its reporting and pipeline dashboard work connects outbound channels and activities to pipeline outcomes, with systems built for client ownership and handover.
If your CRM reports meetings but can't explain the signals, records, and routing decisions behind them, visit The Social Search to discuss a system-first GTM dashboard. Their team can help connect your sending tools, enrichment, routing logic, and pipeline reporting into an operational system your team can run and own.
