Email Marketing Metrics: The Complete KPI Reference
Email Marketing Metrics. Master every email marketing metric that matters in 2026. Definitions, formulas, benchmark ranges, and deliverability KPIs
Email marketing drove an estimated $17.9 billion in 2026 revenue across 4.48 billion users and 361.6 billion daily emails. At that scale, metric discipline becomes a board-level concern because weak measurement can hide lost revenue, damaged sender reputation, and declining audience quality.
The channel's commercial history began in 1978, when Gary Thuerk of Digital Equipment Corporation sent what's widely cited as the first bulk commercial email blast. That campaign reportedly generated $13 million in sales, establishing the principle that email could connect activity directly to revenue. The modern version of that principle requires more than an open-rate dashboard. Teams must authenticate sends, separate genuine engagement from machine-generated signals, and attribute conversions by audience, message type, and lifecycle stage. (Email marketing statistics for 2026)
A useful email marketing metrics program has four connected families: deliverability, engagement, conversion, and revenue. List health sits across the first two, while authentication and compliance determine whether downstream metrics deserve trust. Teams that operationalize these metrics often pair reporting with execution tools, for example Instantly for cold email, deliverability, warming, and sequencing, Apollo for data enrichment, Whitewhale for intent signals, and HeyReach for LinkedIn outreach automation when email performance needs to be viewed alongside multi-channel outbound activity. If your team needs a system for B2B campaign reporting, The Social Search also connects email performance with outbound pipeline, inbox placement, and UTM-based attribution.
Table of Contents
Why Email Marketing Metrics Matter More Than Ever
Email marketing metrics connect a send to an operational and commercial decision. They show whether a message reached its intended audience, whether recipients performed a meaningful action, and whether that action generated value after costs. Open rate now provides limited directional context. Click-through rate, authentication, and revenue attribution carry greater analytical weight.
The channel's scale raises the cost of weak measurement. Global email users were estimated at 4.48 billion in 2026, with approximately 361.6 billion emails sent and received each day. Email marketing revenue was projected at $17.9 billion in 2026, with growth expected toward $24.2 billion by 2029. These figures, reported in 2026 email marketing data, make measurement quality a financial control rather than a reporting preference.
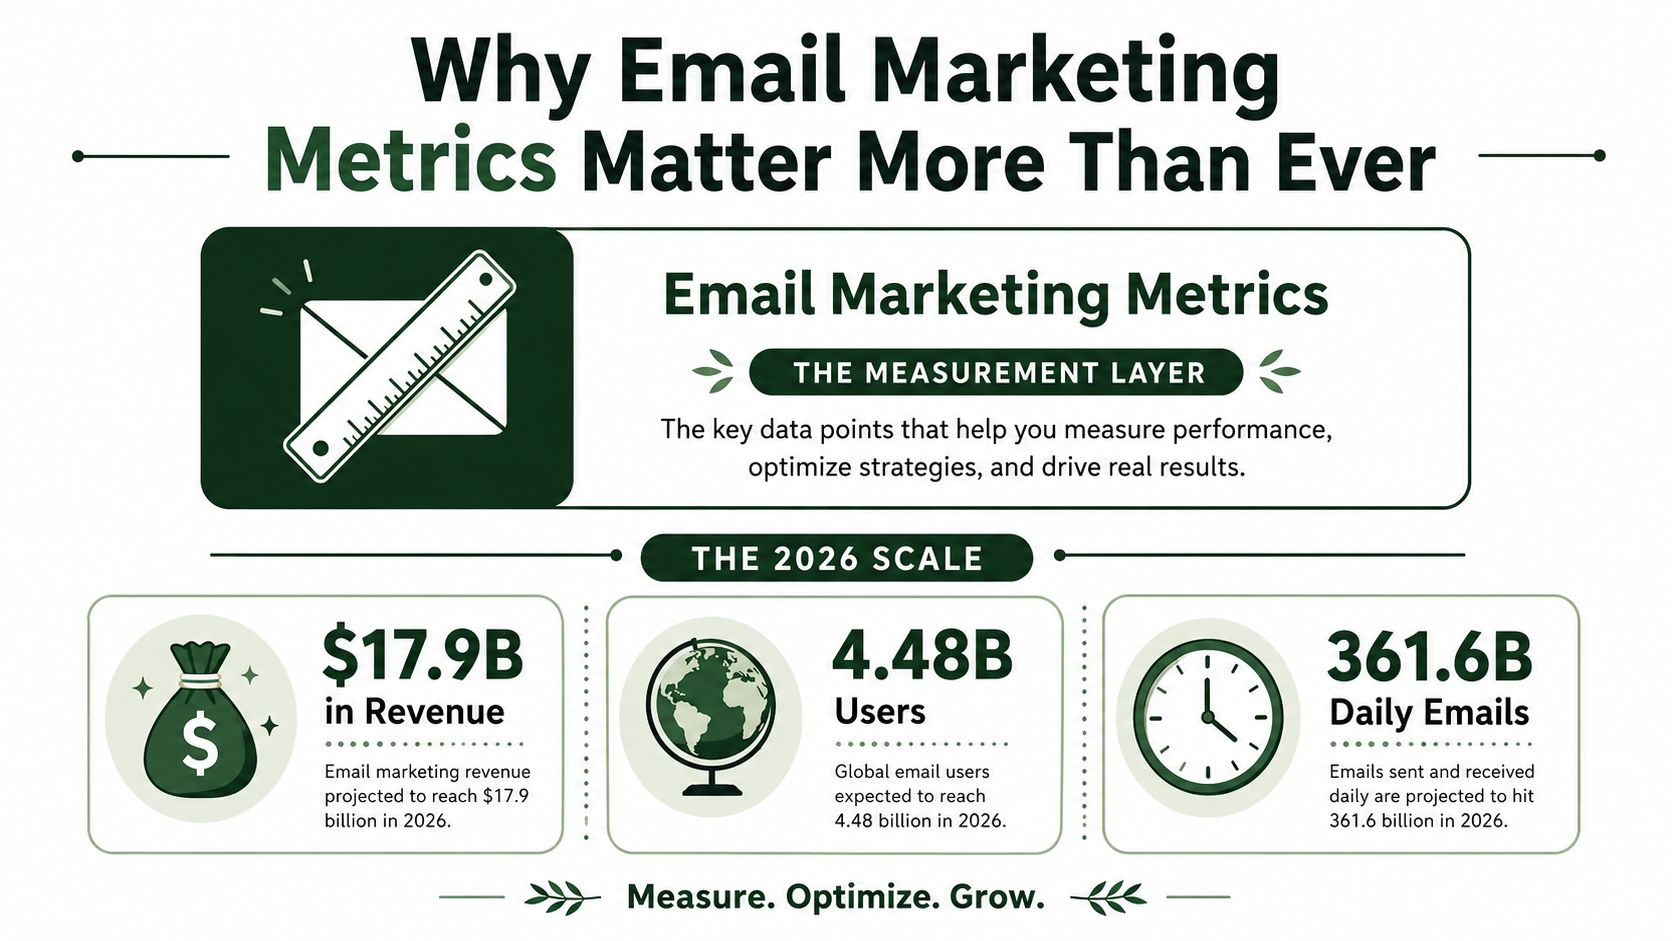
Replace dashboard habits with measurement discipline
A defensible report starts with four questions:
Did the message reach the inbox? Review inbox placement, bounce composition, complaint signals, and authentication results.
Did a person act? Prioritize unique clicks, click-to-open rate, and conversion events over opens alone.
Did the action create business value? Track revenue per email, cost per lead, pipeline influence, and customer lifetime value by segment.
Can the program continue safely? Monitor complaints, unsubscribes, suppression hygiene, and authentication alignment.
SPF, DKIM, and DMARC should appear in the KPI framework, not only in technical documentation. Their results indicate whether the sending domain is authenticated and aligned, conditions that support deliverability and make engagement data more credible. Google and Yahoo's bulk-sender requirements also make DMARC policy, one-click unsubscribe, and From-domain alignment operating requirements for domains sending more than 5,000 messages per day. (Email marketing benchmark guidance)
For a broader explanation of the channel's business role, see why email marketing is important. The practical conclusion is clear: analysts should trace authenticated delivery through clicks and conversions to accountable revenue, while treating opens as a legacy signal rather than the program's primary health measure.
The Four Families of Email Marketing Metrics
A reliable email scorecard separates deliverability, engagement, conversion, and value. These families prevent a strong click rate from masking weak revenue, or a growing audience from hiding declining list quality.
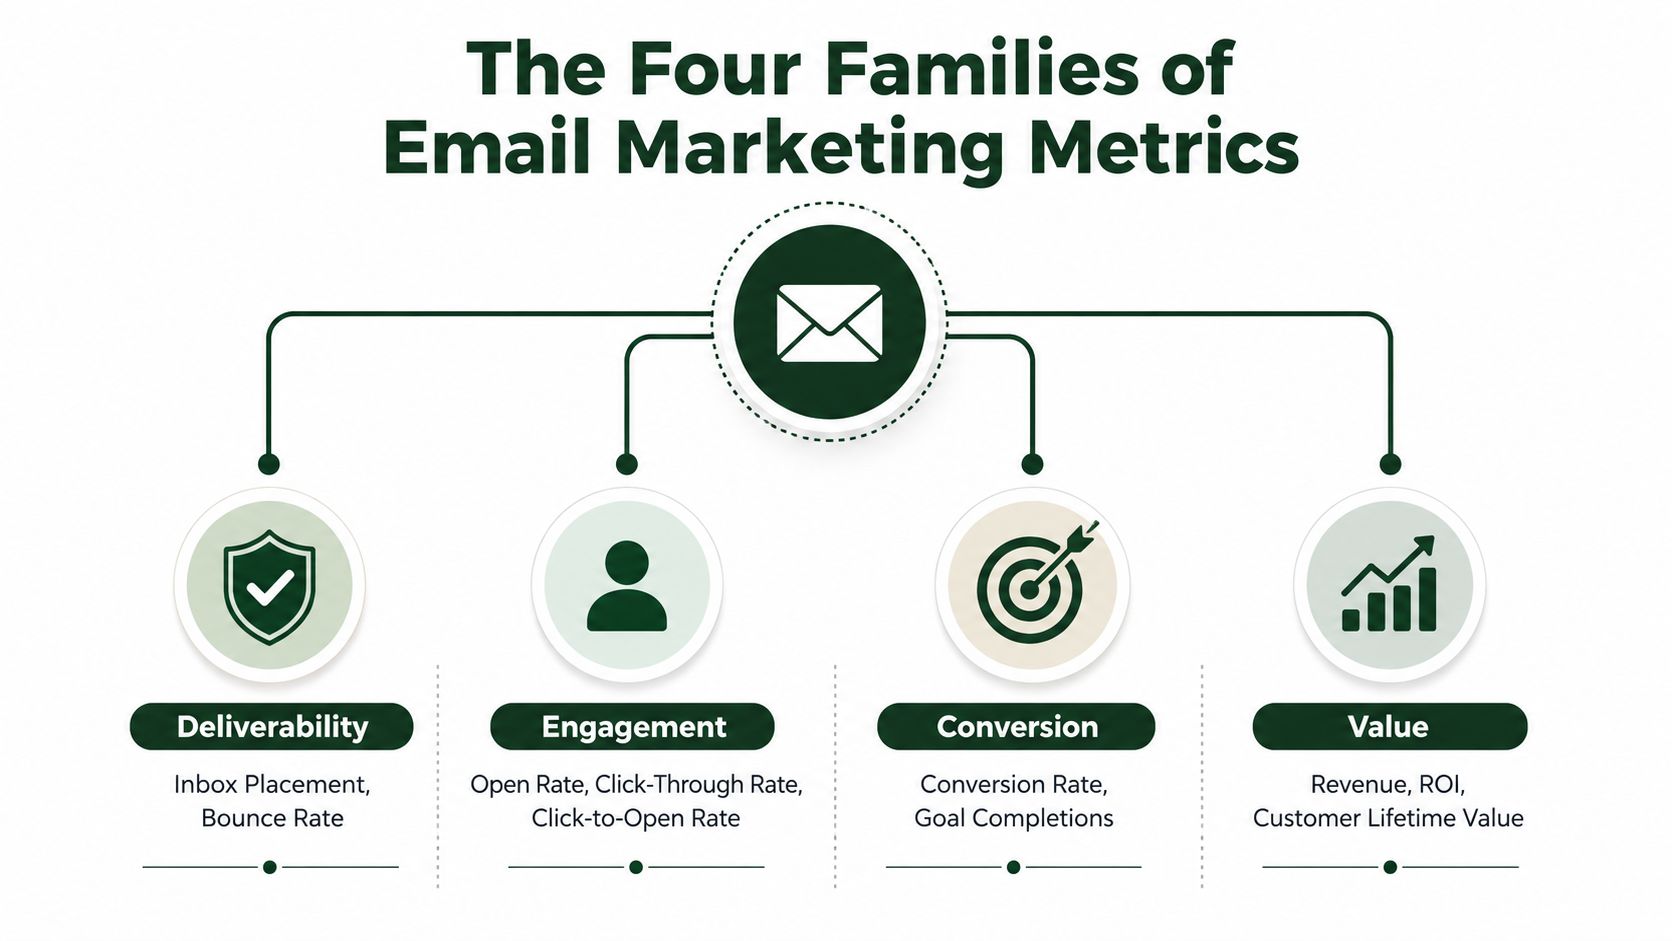
Deliverability establishes the measurement base
Deliverability metrics show whether messages are accepted and reach the intended mailbox location. Measure inbox placement, delivered volume, hard and soft bounces, sender reputation, and authentication results for SPF, DKIM, and DMARC.
This family determines how much confidence to place in downstream results. A weak CTR can reflect ineffective content, limited audience intent, or messages routed to spam. Separating those causes requires delivery data before creative analysis.
Engagement and conversion measure behavior
Engagement metrics record recipient response. Open rate can provide a directional reach check, but Apple Mail Privacy Protection can inflate reported opens by roughly 15 to 20 percentage points. Unique CTR therefore carries more analytical weight. Current benchmark guidance places a healthy CTR above 3%, while a result below 1% warrants investigation. (2026 email marketing benchmarks)
Conversion metrics connect clicks with a defined business outcome, including a purchase, booked meeting, trial activation, or renewal. Keep the formula and event definition consistent across campaigns. Otherwise, comparisons mix different actions and produce unreliable conclusions.
List health and value close the chain
List health metrics include hard bounce rate, soft bounce rate, complaint rate, unsubscribe rate, and net list movement. Together, they show whether current acquisition and sending practices are reducing future reach.
Revenue metrics include revenue per email, return on investment, cost per lead, cost per acquisition, and lifetime value attribution. Teams can use using Mara for lifecycle email metrics to align lifecycle reporting with the customer journey and assign value beyond the initial click.
Authentication spans all four families. SPF, DKIM, and DMARC are measurable operating signals: pass and alignment results help explain delivery quality and indicate whether engagement and revenue data come from authenticated traffic.
Engagement Metrics From Open to Conversion
Engagement reporting should prioritize signals by reliability. Open rate records a tracking event, CTR records a destination visit, CTOR evaluates content among recorded openers, and conversion rate connects the message to a defined business action. In 2026, open rate is best treated as a legacy diagnostic, while clicks and downstream events carry more weight.
The formulas
Open rate equals unique opens divided by emails delivered. Apple Mail Privacy Protection can inflate this result by roughly 15 to 20 percentage points, so use it directionally, not as proof of human attention. (Open-rate and CTR guidance)
Click-through rate equals unique clicks divided by emails delivered. Current guidance places a healthy target above 3%, while results below 1% warrant investigation. CTR is more durable than opens because it requires a recipient to take an observable action.
Click-to-open rate equals unique clicks divided by unique opens. It helps assess the relationship between content and people recorded as openers, but inflated opens can distort the denominator. Read CTOR with CTR rather than using it as a standalone content score.
Conversion rate equals conversions divided by emails delivered. Define the event before launch. A purchase, demo request, activated account, and downloaded resource should remain separate conversion events, not one undifferentiated column.
Metric | Formula | B2C Benchmark | B2B Benchmark | What It Tells You |
|---|---|---|---|---|
Open rate | Unique opens ÷ delivered | 28% to 42% | 24% to 38% | Directional reach, affected by MPP |
CTR | Unique clicks ÷ delivered | 2.1% to 4.5% | 1.8% to 3.8% | Durable engagement and relevance |
CTOR | Unique clicks ÷ unique opens | 10% to 15% | 10% to 15% | Content and CTA quality |
Conversion rate | Conversions ÷ delivered | 1.0% to 2.5% for ecommerce | 0.4% to 1.2% for nurture | Post-click business action |
A 50,000-send worked example
For a campaign sent to 50,000 recipients, suppose the platform records 15,000 unique opens, 1,500 unique clicks, and 500 conversions. The open rate is unique opens divided by delivered messages, CTR is unique clicks divided by delivered messages, CTOR is unique clicks divided by unique opens, and conversion rate is conversions divided by delivered messages. If every message was delivered, the results are 30%, 3%, 10%, and 1%.
Segment context determines whether those figures are useful. Compare sends within the same audience, device mix, lifecycle stage, intent, and send type. A broad newsletter should not be judged against a triggered onboarding message without labeling the difference. For a commercial view of boosting revenue with email analytics, retain the path from click to conversion instead of treating clicks as the endpoint.
List Health Metrics That Catch Trouble Early
List health metrics expose deterioration before engagement reports make it obvious. A shrinking audience, rising permanent failures, or increasing complaints can depress click trends even when content and targeting remain unchanged. These measures are early controls for list quality, not secondary reporting fields.
Separate permanent and temporary failure
A hard bounce is a permanent delivery failure, such as an invalid recipient or blocked domain. A soft bounce is temporary, often caused by a full mailbox, transient server issue, or deferred delivery. Calculate each rate by dividing its bounce count by delivered emails, and keep the denominator consistent across reports.
Suppress hard-bounced addresses immediately. Soft bounces require pattern analysis. One temporary failure may be harmless, while repeated deferrals from the same recipient domain can indicate a delivery or throttling problem.
Track audience loss as a system
Complaint rate equals spam complaints divided by delivered messages. Unsubscribe rate equals unsubscribes divided by delivered messages. Net list growth compares new valid subscribers with unsubscribes, hard bounces, suppressions, and other removals. Gross additions alone can conceal list decay.
Use the following operating references for triage: hard bounces below 0.5%, complaints below 0.02%, and unsubscribes between 0.1% and 0.3% per send. These are reference points, not universal pass or fail rules. Segment them by acquisition source, lifecycle stage, mailbox provider, and send type before changing a program.
Metric | Formula | Healthy Range | Alert Threshold |
|---|---|---|---|
Hard bounce rate | Hard bounces ÷ delivered | Under 0.5% | At or above 0.5% |
Soft bounce rate | Soft bounces ÷ delivered | Stable and explainable | Persistent or rising pattern |
Complaint rate | Complaints ÷ delivered | Below 0.02% | At or above 0.02% |
Unsubscribe rate | Unsubscribes ÷ delivered | 0.1% to 0.3% | Outside expected range |
Net list growth | Valid additions minus losses | Positive movement | Flat or negative movement |
Use these signals to trigger re-engagement, sunset policies, and suppression updates. Before scaling a campaign, run email deliverability testing guidance. Then compare list health across acquisition sources and lifecycle stages. A complaint spike among recently acquired contacts suggests an expectation mismatch. Repeated soft bounces concentrated at one domain suggest a delivery or throttling issue, not necessarily weak content.
Deliverability Metrics and Authentication Signals
Inbox placement is the first measurable gate in the email chain. If messages fail to reach the inbox, open, click, conversion, and revenue results describe only the portion that passed delivery filters.
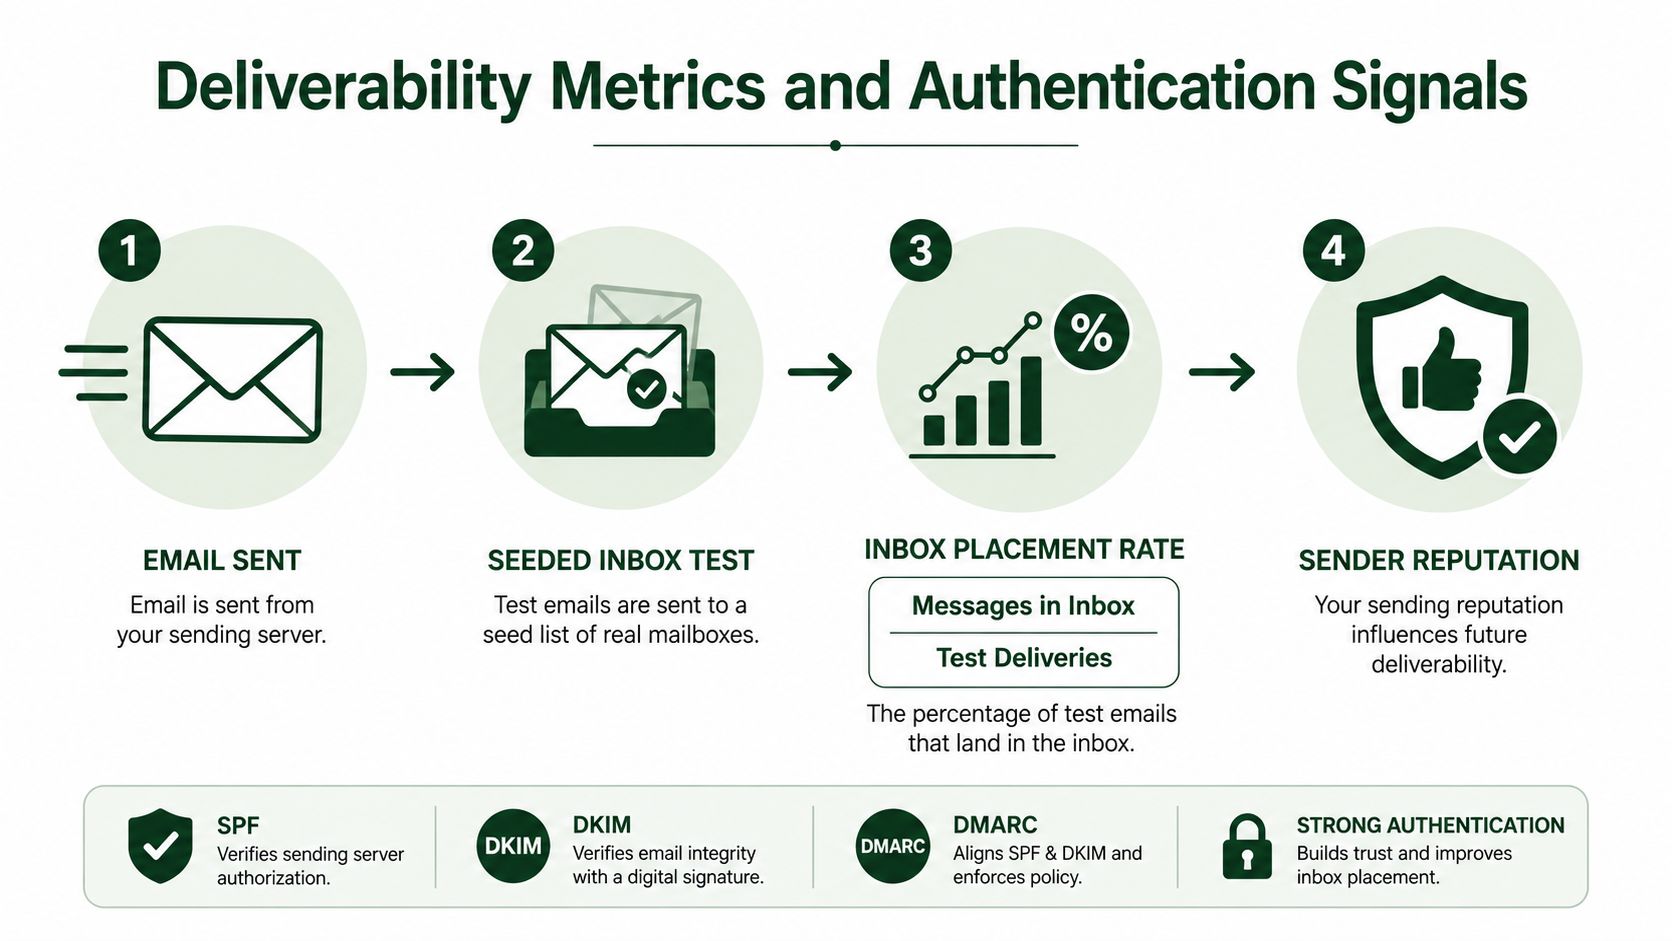
Build the causal chain
Inbox placement rate equals messages reaching the inbox divided by seeded inbox test deliveries. Seeded tests cannot reproduce every recipient condition, but they provide a controlled directional signal that accepted-delivery data cannot.
Report placement by mailbox provider, sending stream, domain, and campaign type. Aggregate placement can conceal a provider-specific failure while other domains remain stable. Pair the result with sender reputation data from Google Postmaster Tools and Microsoft SNDS. Reputation is explanatory, not the outcome itself. It can clarify changes following complaint spikes, volume shifts, authentication failures, or list-quality deterioration.
Turn authentication into KPIs
SPF, DKIM, and DMARC are measurable controls, not background configuration. SPF verifies authorized sending, DKIM supports message integrity, and DMARC evaluates alignment with the visible From domain. The relevant standards are SPF RFC 7208, DKIM RFC 6376, and DMARC RFC 7489.
Track each as an operational percentage:
SPF pass rate: authenticated messages passing SPF divided by analyzed messages.
DKIM signature success rate: messages with a valid DKIM signature divided by analyzed messages.
DMARC alignment rate: messages passing DMARC alignment divided by analyzed messages.
ISP complaint rate: complaints divided by delivered messages for each mailbox provider.
Major mailbox providers require authenticated mail. Google and Yahoo bulk-sender requirements also include DMARC, one-click unsubscribe, and From-domain alignment for domains sending more than 5,000 messages per day. (Bulk-sender requirements)
Apply email deliverability best practices when connecting authentication reports with placement results. The useful analytical chain is authentication, reputation, placement, engagement, conversion, and revenue. Measuring only the final outcome leaves analysts unable to identify whether a performance change began with technical compliance, mailbox filtering, or subscriber behavior.
Revenue Metrics That Tie Email to Pipeline
Revenue reporting gives email a defensible role in commercial planning. Engagement indicates intent, while revenue metrics show whether the program generates value relative to operating cost and contact pressure.
Start with unit economics
Revenue per email equals total campaign revenue divided by delivered emails. Revenue per recipient uses unique recipients instead, making campaign comparisons fairer when delivery or suppression patterns differ.
ROI equals (revenue minus cost) divided by cost. The denominator should include platform fees, creative production, data or list acquisition, and relevant operational labor. Finance should document these inputs because B2B and B2C programs rarely share the same cost structure.
Cost per lead equals campaign cost divided by attributed leads. Cost per acquisition equals campaign cost divided by attributed customers or completed acquisition events. The formulas are straightforward. Attribution rules determine whether the output supports a budget decision.
Give email fair pipeline credit
Use consistent UTM parameters, including utm_medium=email, and distinguish links when the team needs to identify which destination generated a visit. Compare first-touch, last-touch, and assisted models. Assigning every outcome to the last click can understate email's role in longer buying cycles.
A cohort-based view connects the original email interaction with later purchases and shows whether lifecycle campaigns create durable customer value. For example, a $2 first purchase may connect to a $480 lifetime value customer, but only when the organization preserves customer identity, campaign history, and subsequent transactions.
Revenue attribution also depends on the reporting system's data access. Teams evaluating email delivery platforms should examine campaign, recipient, conversion, and revenue reporting, not sending capability alone. Industry reporting describes a shift toward revenue-oriented measurement, with multi-channel attribution and MQLs rising 22% year over year. It also identifies newsletters and onboarding as stronger program priorities than undifferentiated blasts. (State of email reporting)
The practical test is reconciliation: attributed email revenue should match transaction records, agreed attribution windows, and documented exclusions. If those three do not align, the dashboard is presenting allocation rather than proven pipeline impact.
Why Open Rate Is a Legacy Signal in 2026
Apple Mail Privacy Protection can inflate reported opens by roughly 15 to 20 percentage points, weakening subject-line tests, inactive-user segmentation, and reach comparisons based on open rate alone. The 2026 benchmark guidance supports treating opens as an imperfect signal rather than a direct record of reading.
Keep the metric, but demote it. Open rate works as a reach sanity check, helping analysts spot unusual changes in delivery or visibility. It should not serve as primary evidence that a recipient read the message.
CTR provides a stronger engagement test because it requires a measurable destination action. Analysts still need to account for bot filtering, link placement, device behavior, and the difference between a primary CTA and a low-intent footer link. Even with those controls, a click reflects more intent than a tracking pixel load.
Dashboard rule: Use open rate to assess whether delivery and visibility look plausible. Use CTR, CTOR, conversion rate, and revenue per recipient to decide what to change.
Place CTR beside delivered volume, click-to-open rate, conversion, complaint rate, authentication results, and revenue. SPF, DKIM, and DMARC results belong in the same operating view because authentication affects whether engagement can occur at all. Subject-line tests may retain opens as directional input, but final decisions should weigh clicks and downstream conversion. This stack limits privacy-generated activity and gives revenue attribution greater influence over segmentation and creative strategy.
Compliance Metrics That Double as Deliverability Levers
Compliance produces operational data, not only legal documentation. Those records also indicate whether mailbox providers and recipients can trust future messages. Track each requirement as a field with an owner, timestamp, status, and exception path.
Translate rules into reporting fields
Google and Yahoo bulk-sender requirements apply to domains sending more than 5,000 messages per day. They include a DMARC policy, one-click unsubscribe, and alignment between the visible From domain and authentication records. The bulk-sender benchmark requirements provide the threshold context. Report policy presence and alignment separately, because a configured record does not prove that every message passes authentication.
CAN-SPAM requires commercial email to provide a clear opt-out mechanism. Requests must be honored within 10 business days. The process cannot charge a fee, demand extra personal information, or require more than a single step. Use the CAN-SPAM benchmark guidance to document the obligation, then measure actual suppression speed.
Requirement | Numeric Threshold | KPI to Track | Deliverability Impact |
|---|---|---|---|
DMARC for bulk sending | More than 5,000 messages daily | DMARC policy and alignment status | Supports authenticated, aligned sending |
One-click unsubscribe | Required for applicable bulk senders | Successful one-click processing rate | Reduces friction and complaint risk |
CAN-SPAM opt-out | Honor within 10 business days | Unsubscribe latency | Limits unwanted future delivery |
Complaint control | Below 0.02% operating reference | Complaint rate by mailbox provider | Protects sender reputation |
Authentication | SPF, DKIM, and DMARC checks | Pass and alignment rates | Helps receivers verify the sender |
Consent capture, preference records, suppression-list updates, and regional disclosures should be auditable by source and timestamp. GDPR consent and CCPA disclosure obligations vary by audience, jurisdiction, and legal basis. The useful KPI is coverage and traceability, not a fabricated universal pass rate.
Use email marketing laws as a starting point for reviewing applicable rules, then have counsel validate implementation. One-click opt-out, rapid suppression, low complaints, and aligned SPF, DKIM, and DMARC reduce unwanted or unverifiable mail. Compliance therefore becomes a measurable deliverability lever, with authentication and suppression results reviewed alongside engagement and revenue outcomes.
Email Marketing Metrics Comparison Table
Use this table to build a diagnostic dashboard rather than a report of isolated averages. Separate results by B2B or B2C audience, lifecycle stage, send purpose, and mailbox provider. In 2026, click and conversion signals should carry more decision weight than opens, while authentication metrics show whether messages can be trusted and delivered.
Metric | Family | Formula | 2026 Reference | Alert Threshold | Interpretation |
|---|---|---|---|---|---|
Open rate | Legacy engagement | Unique opens ÷ delivered | B2C 28% to 42%, B2B 24% to 38%, with MPP inflation | Unusual movement | Use for directional diagnosis, not primary performance judgment |
CTR | Engagement | Unique clicks ÷ delivered | Above 3% target | Below 1% | Stronger evidence of content and offer relevance |
CTOR | Engagement | Unique clicks ÷ unique opens | 10% to 15% | Falling trend | Interpret cautiously because its denominator includes privacy-affected opens |
Conversion rate | Conversion | Conversions ÷ delivered | B2C ecommerce 1.0% to 2.5%, B2B nurture 0.4% to 1.2% | Below segment baseline | Define the conversion event and attribution window |
Hard bounce rate | List health | Hard bounces ÷ delivered | Under 0.5% | At or above 0.5% | Suppress permanent failures promptly |
Soft bounce rate | List health | Soft bounces ÷ delivered | Stable pattern | Persistent rise | Check mailbox capacity, provider behavior, and sending patterns |
Complaint rate | List health | Complaints ÷ delivered | Below 0.02% | At or above 0.02% | Break out results by ISP and send type |
Unsubscribe rate | List health | Unsubscribes ÷ delivered | 0.1% to 0.3% | Outside expected range | Review frequency, relevance, and audience expectations |
Inbox placement | Deliverability | Inbox messages ÷ seeded deliveries | Establish a provider baseline | Declining trend | Treat seed tests as directional, not a complete mailbox view |
SPF pass rate | Authentication | SPF passes ÷ analyzed messages | Consistently passing | Any unexplained failure | Identify unauthorized or missing sending sources |
DKIM success rate | Authentication | Valid signatures ÷ analyzed messages | Consistently passing | Any unexplained failure | Check signing configuration for every stream |
DMARC alignment | Authentication | Aligned messages ÷ analyzed messages | Consistently aligned | Misalignment trend | Confirm that the visible From domain aligns with authentication |
Revenue per email | Revenue | Attributed revenue ÷ delivered | Compare against cost | Below break-even | Segment by send type and attribution rule |
ROI | Revenue | (Revenue minus cost) ÷ cost | Positive and improving | Below zero | Include the full program cost |
SPF, DKIM, and DMARC belong in the KPI layer, not only in technical documentation. A passing rate without alignment can still leave the visible sender difficult to verify, so review authentication by domain, stream, and mailbox provider. Pair those results with CTR, conversion rate, and attributed revenue to distinguish weak content from delivery or identity problems.
Revenue metrics also require an explicit attribution window and event definition. Otherwise, a high-performing send can reflect tracking gaps, while a low result may exclude assisted pipeline or delayed purchases. The table becomes useful when each metric has a named owner, a fixed formula, and a segment baseline that supports action.
Quick Reference and 30-Day Diagnostic Checklist
用這套順序診斷,先確認送達與身分,再判讀互動和收入。
KPI | Formula | 2026 Reference |
|---|---|---|
CTR | Unique clicks ÷ delivered | Above 3% target, below 1% alert |
Open rate | Unique opens ÷ delivered | B2C 28% to 42%, B2B 24% to 38%, with MPP inflation |
CTOR | Unique clicks ÷ unique opens | 10% to 15% |
Conversion rate | Conversions ÷ delivered | B2C ecommerce 1.0% to 2.5%, B2B nurture 0.4% to 1.2% |
Hard bounce | Hard bounces ÷ delivered | Under 0.5% |
Complaint rate | Complaints ÷ delivered | Below 0.02% |
Unsubscribe rate | Unsubscribes ÷ delivered | 0.1% to 0.3% |
Revenue per email | Revenue ÷ delivered | Positive against program cost |
The 30-day workflow
Week one: 檢查 SPF、DKIM、DMARC、收件匣位置、退信突增,以及各郵件服務商的投訴率。
Week two: 按受眾檢視 CTR、CTOR 趨勢與轉換事件,並標記開信率受 MPP 影響的部分。
Week three: 清除硬退信,啟用沉睡訂閱者規則,重新接觸仍具互動可能的名單。
Week four: 核對每封郵件收入、ROI、UTM 資料,以及首次接觸與協助管線的歸因。
FAQ
Which metric matters most if you can track only one? CTR,因為它記錄實際點擊行為,通常比開信率更能反映互動。
How often should benchmarks be refreshed? 每季檢視一次。隱私設定、郵件服務商或寄信政策改變時,也應重新檢查。
Is a 50% open rate automatically realistic after MPP? 不是。它只能作為需要脈絡的追蹤訊號,不能直接證明真人互動。
SPF、DKIM、DMARC 應列入 KPI,而不只是技術文件。按網域、寄送串流與郵件服務商檢查通過率和對齊狀態,再與 CTR、轉換率及歸因收入交叉分析,才能分辨內容問題、送達問題與寄件身分問題。收入判讀也要固定歸因期間、事件定義、負責人與公式。
The Social Search 建立並營運 B2B outbound systems,涵蓋 ICP、資料、訊息、電子郵件與 LinkedIn 流程、送達率和管線報告。你可透過 The Social Search 討論從已驗證寄送到合格管線的歸因系統。
