Email Deliverability Score Explained and How to Improve It
Learn what email deliverability score means, how it's measured, what hurts it, and how to improve it for high-volume outbound email systems.
Your outbound sequence is live. The sending platform reports successful delivery, the copy has been reviewed, and the list looks large enough to support pipeline. Yet replies remain sparse, meetings don't move, and Gmail performance looks noticeably worse than the aggregate dashboard suggests.
That situation often gets misdiagnosed as a copy problem. Sometimes the issue is that messages are being accepted by receiving servers but routed to spam, promotions, or another low-visibility location. Email deliverability score gives you a diagnostic lens for that gap, provided you treat it as a system signal rather than a single vanity number.
This guide explains what the score measures, how weighted models calculate it, why provider-level results can contradict a blended score, and how to improve the underlying sending system. For teams building outbound infrastructure, Instantly for cold email deliverability and warming can support sending operations, while Apollo for data enrichment can help improve the accuracy and relevance of contact data before a sequence begins.
Useful outbound decisions also depend on the quality of the sales research behind each message. Teams that want a broader perspective on research-driven sales content can use it to connect targeting, evidence, and messaging instead of treating deliverability as an isolated technical task. The same principle applies to why email marketing is important: reaching a recipient is only valuable when the message is visible, relevant, and trusted.
Table of Contents
Introduction Why Your Emails Send But Never Land
A founder opens the outbound dashboard and sees reassuring activity. Emails have left the platform. The sequence is running. Contacts are being added. But the reply column is quiet, and the sales team starts rewriting subject lines.
That response makes sense, but it can send the team in the wrong direction. If messages are accepted by a mailbox provider and then filtered away from the primary inbox, better copy won't solve the immediate problem. The first question should be, where are the emails landing, and how consistently across providers?
An email deliverability score helps answer that question. It estimates the health of your sending identity using signals such as inbox placement, authentication, reputation, technical compliance, complaints, bounces, and engagement. The score is useful because it turns an invisible infrastructure problem into something a revenue team can monitor, investigate, and improve.
Practical rule: A delivered email isn't necessarily a visible email.
For a small outbound program, a modest placement gap may be hard to notice. At high volume, the same gap can remove a meaningful share of potential conversations from the sales process. The verified benchmark data shows why teams should take the metric seriously. One 2026 benchmark placed average inbox placement across major email service providers at 83.1%, meaning roughly 16.9% of legitimate messages still failed to reach the inbox, while another 2026 dataset reported a global inbox placement rate of 87.2%, up from 83.5% year over year (Landbase's email deliverability statistics).
Those figures aren't interchangeable universal truths. They demonstrate that benchmarks vary by dataset, provider mix, authentication, reputation, and filtering conditions. Your job isn't to chase a score in isolation. It's to understand what the number is hiding and connect it to actual pipeline performance.
This distinction matters for founders and SDR leaders. A healthy outbound machine connects ICP definition, data quality, message relevance, sending infrastructure, provider-level monitoring, and reporting. If one part fails, the dashboard can still show activity while buyers never see the message.
What Email Deliverability Score Actually Measures
Think of an email deliverability score as a credit score for your sending identity. A credit score doesn't guarantee that a lender will approve a particular application. It summarizes signals that help a lender estimate risk. Similarly, deliverability scoring estimates how likely mailbox providers are to place your emails in visible inboxes.
It isn't the same as open rate. It also isn't the same as delivery rate.
Delivery rate asks whether the receiving server accepted the message.
Inbox placement asks whether the message reached a visible inbox location rather than spam or another filtered folder.
Engagement shows how recipients interact with the message, including opens, clicks, replies, complaints, and bounces.
Deliverability score combines these and related signals to estimate sending health.

The difference between readiness and outcome
Technical readiness means your domain has the expected authentication and transport foundations. Actual inbox placement is the outcome mailbox providers produce after evaluating those foundations alongside reputation, complaints, list quality, and recipient behavior.
That difference creates one of the most common misunderstandings in outbound. A team can configure SPF, DKIM, and DMARC correctly and still experience weak inbox placement if recipients rarely engage, complain about unsolicited messages, or receive outreach that doesn't match their expectations.
A practical deliverability model therefore treats the score as an operational input to pipeline planning. If your provider-level placement declines, fewer prospects see the message, which reduces the number of opportunities available for replies and meetings even when the sequence continues sending normally.
Why a few points matter
The impact of a score change depends on volume. The benchmark data describes deliverability as a core operational metric because a few percentage points can create large differences in actual pipeline volume when millions of emails are sent (Landbase's benchmark discussion).
You don't need to interpret the score as a promise. Use it as a warning instrument. A declining score should trigger an investigation into provider placement, complaints, authentication alignment, list quality, and sending behavior before the team increases volume.
How Email Deliverability Score Is Calculated
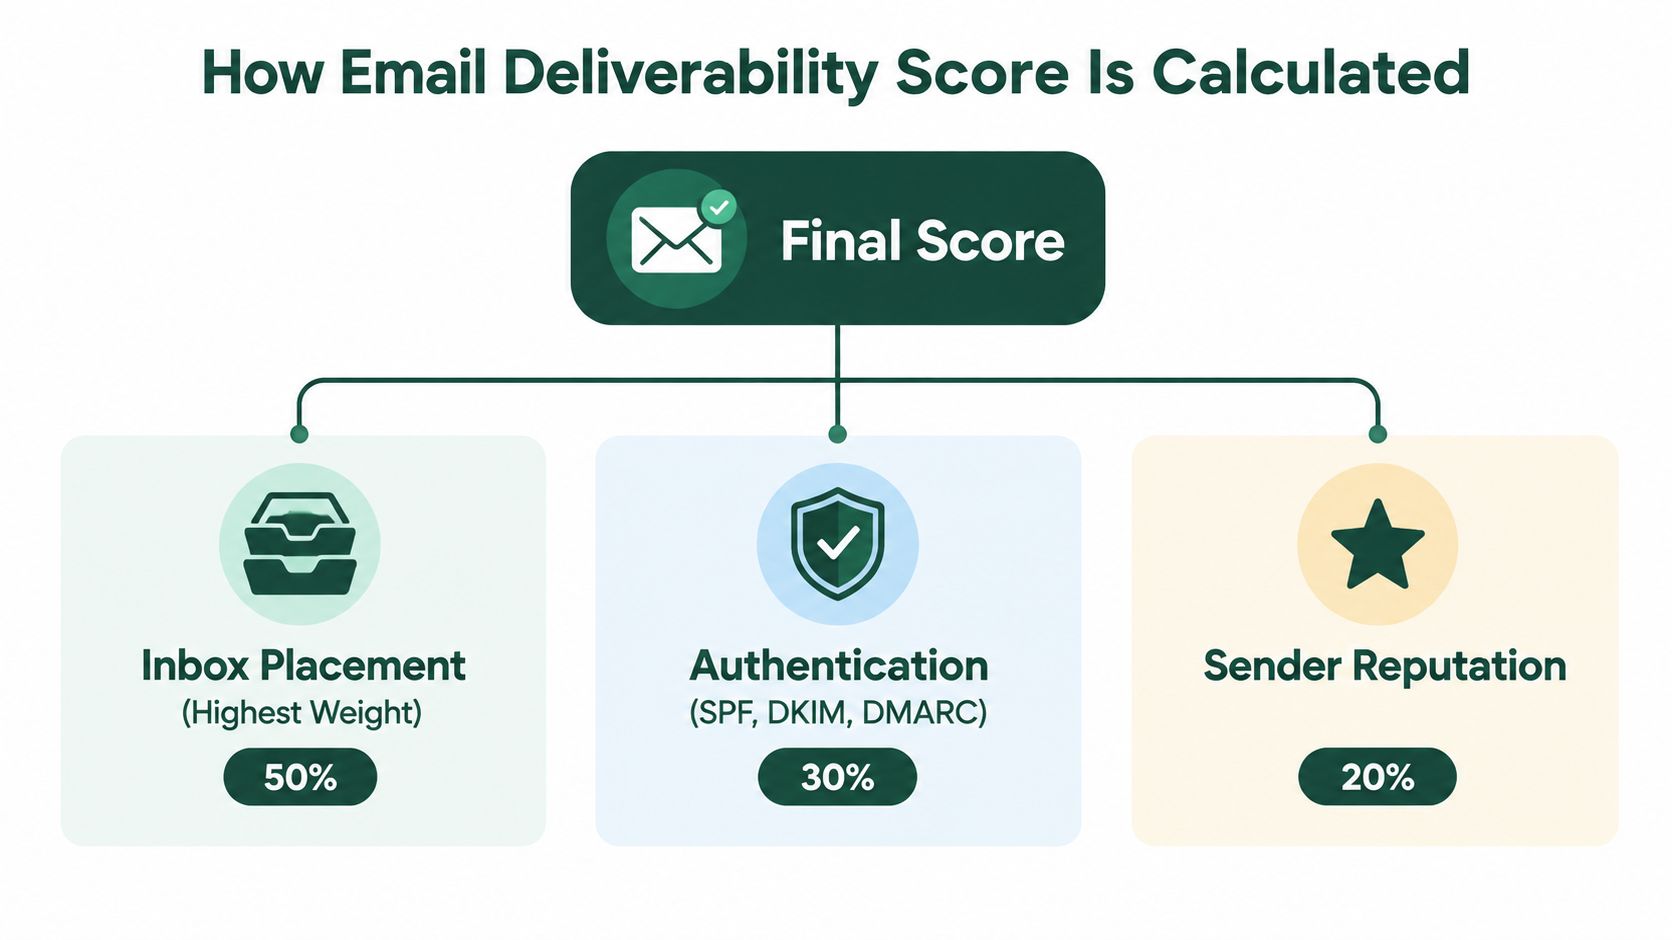
A practical independent health model uses a 0 to 100 scale with four weighted components: inbox placement at 60%, authentication at 25%, sender reputation at 10%, and technical compliance at 5% (MessageFlow's deliverability guide).
That weighting immediately changes how you prioritize fixes. Inbox placement carries more weight than the other components combined. Authentication matters, but strong SPF, DKIM, and DMARC settings can't fully compensate for poor recipient engagement or weak list quality.
Start with the largest signal
Inbox placement is the closest part of the model to the business outcome. It tells you whether messages reach the location where recipients are likely to notice them. A high delivery rate can coexist with poor placement if providers accept messages but route them away from the inbox.
Authentication verifies that your sending identity is legitimate and aligned. SPF identifies authorized senders, DKIM applies message-level signing, and DMARC connects authentication results with domain policy and alignment. These standards help mailbox providers distinguish legitimate sending from spoofing and suspicious infrastructure.
Sender reputation reflects historical behavior. Complaint patterns, engagement, sending consistency, and list quality can affect how providers evaluate future messages. Reputation is built over time, so a short burst of improved copy won't instantly undo a damaged sending history.
Technical compliance covers the baseline mechanics that allow messages to move through the email system reliably. It supports delivery, but it shouldn't be confused with inbox placement.
The model is useful for prioritization, not as a universal law. Providers apply their own filtering systems, and their decisions can differ by recipient domain. That means a blended score may look acceptable while Gmail, Yahoo, or another provider performs poorly.
The distinction resembles broader email performance measurement. Teams reviewing email marketing metrics should keep delivery, placement, engagement, complaints, and pipeline attribution separate. Combining them too early makes it difficult to identify the actual failure point.
Common Causes of a Low Email Deliverability Score
Low scores usually come from system behavior, not one unfortunate subject line. The most useful diagnosis connects a visible symptom to the sending practice that caused it.

Authentication gaps
SPF, DKIM, and DMARC form the technical identity layer. Missing records, misalignment, incomplete coverage for sending services, or weak DMARC enforcement can make it harder for mailbox providers to trust the sender.
Adoption remains incomplete. Research across 5.5 million domains in February 2026 found SPF adoption at 56.0%, DKIM at 22.7%, and DMARC at 30.4%. Only 12.8% enforced DMARC policies, while DMARC adoption reached 62.5% among the top 10,000 domains (DMARC's authentication research). The gap shows why technical setup remains a meaningful differentiator, but it doesn't prove that authentication alone guarantees inbox placement.
Weak list quality and poor targeting
A list can contain technically valid addresses and still create deliverability risk. Contacts who don't recognize the sender may ignore the message, delete it, unsubscribe, or report it as spam. Old, inaccurate, or poorly matched records create the same problem through bounces and negative engagement.
Data enrichment helps only when the team uses it to improve relevance. Apollo can support contact research, but the operating rule is simple: don't add volume faster than you can validate fit and context.
Complaint and bounce pressure
Mailbox providers treat complaints as a direct signal that recipients don't want the messages. The widely used healthy complaint target is below 0.1%, roughly 1 complaint per 1,000 delivered emails, while 0.3% is treated as a critical boundary (Unspam's deliverability benchmark).
Google recommends staying below 0.1% as the safer operating target, while Google and Yahoo's bulk-sender guidance sets a user-reported spam-rate ceiling of 0.3% (Litmus' summary of Yahoo and Gmail rules). When complaints rise, changing infrastructure without changing targeting or volume usually misses the cause.
Volume spikes and weak engagement
Sudden increases can make an established sending identity look abnormal. A new domain or IP also needs a gradual history, rather than an immediate jump to maximum volume. Tools such as Instantly may help operators manage warming and sequences, but the team still needs to control the underlying audience, cadence, and complaint response.
Low opens, clicks, and replies provide weak positive evidence. Repeated non-engagement can tell providers that recipients don't value the messages, which makes future placement harder.
How to Diagnose and Benchmark Your Deliverability Score
Start with the score, then inspect the components. One independent model classifies 85 to 100 as excellent, 70 to 84 as good, and anything below 70 as needing attention (MessageFlow's scoring thresholds). Another benchmark family labels 89% or higher as good inbox placement and 95% or higher as excellent, which helps explain why low-to-mid 80s placement may be workable but weak for high-scale outbound (Landbase's benchmark analysis).
Use these bands as operating signals, not guarantees. A score can look strong while one provider filters your campaigns aggressively.
Deliverability Health Benchmarks at a Glance
Health Band | Inbox Placement / Score Signal | Spam Complaint Rate | What It Means and What to Do |
|---|---|---|---|
Healthy | Excellent score band or placement near the excellent benchmark | Below 0.1% | Maintain authentication, monitor providers, and scale gradually. |
Warning | Good but not excellent score or placement in the low-to-mid 80s | 0.1% to below 0.3% | Reduce pressure, tighten targeting, review engagement, and investigate provider-level placement. |
Critical | Score below 70 or materially weak provider placement | 0.3% or higher | Pause scaling, clean the list, reduce volume, correct alignment, and rebuild reputation before resuming. |
The table combines the verified score and complaint thresholds, but inbox placement still deserves separate attention. In 2025 benchmark reporting, a global deliverability health score of 86/100 was associated with a warning that technical readiness alone doesn't ensure delivery. Another 2026 report described a global health score of 87/100 alongside only 66% of emails reaching a visible mailbox location (Unspam's email deliverability report). A good score can therefore coexist with poor business outcomes.
Check the provider breakdown
Google and Yahoo introduced stronger bulk-sender expectations around authentication and complaints. Gmail requirements apply when a sender sends 5,000 or more emails per day to Gmail addresses, which triggers additional obligations (Google Postmaster Tools documentation).
Don't rely on one blended dashboard. Compare Gmail, Yahoo, Outlook, and other important recipient domains using seed-list tests, provider reporting, complaint feedback, and actual campaign data. Teams building monitoring workflows may also find how AI coworkers surface metrics useful when deciding which signals deserve attention first.
For a practical testing process, use email deliverability testing guidance to verify authentication, inspect content, send with production headers and links, and compare inbox placement across providers.
Practical Steps to Improve Deliverability for High Volume Outbound
Improvement works best as a sequence. Fix identity first, then control volume and audience quality, then use engagement and provider feedback to decide whether scaling can continue.

Align the sending identity
Verify that every sending service is represented in your authentication and alignment strategy. Confirm SPF, DKIM, and DMARC behavior before increasing campaign volume. The outcome you want is consistent identity recognition across mailbox providers.
Don't treat this as a one-time setup. Document who owns the domain, which tools send mail, how failures are reviewed, and what happens when a new platform is added.
Warm gradually and segment traffic
Use a gradual sending pattern for new infrastructure and recently repaired identities. Keep traffic predictable, separate campaigns by audience or purpose, and throttle when complaints or placement deteriorate.
Pause scaling when provider-level placement drops, complaints approach the warning zone, or bounce patterns indicate list problems. Resume only after the relevant signal improves and remains stable through controlled testing.
Clean the list and sharpen the ICP
Remove invalid, outdated, and poorly matched contacts. Tighten the ideal customer profile so the message reaches people with a credible reason to care. Better data reduces avoidable negative signals, while stronger targeting gives recipients a reason to engage.
Signal-driven outreach can help coordinate timing across channels. HeyReach for LinkedIn outreach and Trigify for social signals are relevant when a team wants to combine email with LinkedIn or social context instead of increasing email volume blindly.
Align content with recipient intent
Keep the message clear, recognizable, and easy to act on. Use a sender identity prospects can understand, avoid misleading promises, and make the reason for contact obvious. Follow-up should add context rather than repeat the same request.
Teams refining follow-up logic can review smarter follow-up to increase sales for ideas on sequencing conversations around buyer context. For broader execution guidance, use email deliverability best practices as a checklist.
Monitor feedback before expanding
Review provider-level placement, complaints, bounces, replies, and meaningful engagement. Gmail and Yahoo may behave differently, so a strong aggregate result shouldn't override a clear provider-specific decline.
Set a human decision rule. If the score improves but visible inbox placement or replies worsen, stop scaling and investigate the mismatch. Technical compliance is a prerequisite, not proof that the system is producing pipeline.
Building a Deliverability System That Scales With You
A durable deliverability program has an owner, a documented process, and a clear handoff. It connects ICP definition, contact data, messaging, sending infrastructure, provider diagnostics, and pipeline reporting instead of assigning each part to a separate dashboard.
Use the email delivery platforms overview when comparing infrastructure choices, but keep the operating model independent of any single tool. The team should know which domain is sending, which audience is receiving, which providers are underperforming, and what action follows each warning.
For APAC and global outbound, maintain provider-level views rather than one blended score. Re-warm when infrastructure changes or reputation drops. Segment traffic when a provider or market behaves differently. Attribute meetings and pipeline to the combination of audience, message, signal, and sending conditions, not to volume alone.
The practical handover checklist is straightforward:
Identity: Authentication is aligned and documented.
Audience: Lists are validated against the ICP.
Volume: Sending increases gradually and pauses when risk signals rise.
Placement: Gmail, Yahoo, Outlook, and other relevant providers are monitored separately.
Reporting: Deliverability connects to replies, meetings, and pipeline.
The Social Search designs and operates system-first outbound programs that connect ICP, data, messaging, sending, routing, and reporting for B2B teams selling into APAC and global markets. Visit The Social Search to discuss a deliverability-aware outbound system your team can own, document, and scale responsibly.
